Foreword
This fifth strand of analysis was conceived as an independent empirical check of the TYRN SEA index. All prior work on bloom and mucilage risk relied solely on physical quantities measured by Copernicus Marine Service sensors. To close the methodological loop, one question remained: do those physical values predict anything observable in social reality? If the index is well built, the hottest summers, the ones it flags as maximum risk, should match an increase in dirty-sea reports from Calabrian citizens on social media.
A note on what this test can and cannot say. A post count is a perception proxy, not an environmental measurement: if it rises with the heat, that alone does not prove that heat "causes" the dirty sea, because hot years also bring more swimmers, more beach days, more photos and more media attention. The correct reading is therefore cautious: we look for a perception signal consistent with the warmth, while stating its limits.
The opportunity came with Meta's approval of a request to access the Meta Content Library programme: the archive of public Facebook content made available to researchers for scientific investigations, hosted in a secure Amazon WorkSpaces environment. Raw data cannot leave that environment; only aggregates and statistics can, after review.
1. The research question
The question is simple but has a strong methodological angle: is there a measurable correlation between the summer thermal anomaly of the Calabrian coasts and the number of dirty-sea reports produced by citizens on social media?
If the answer is positive and statistically solid, the TYRN SEA index, built without looking at a single post, becomes a tool for predicting an independent social signal. It would be a case of cross-domain validation: the physical model anticipating a collective behaviour. As we shall see, this holds robustly on only one of the five zones, and remains suggestive but not conclusive on the others.
2. Selected sources
The Content Library API allows querying posts from public pages and groups. To avoid the noise of a search open to all of Facebook, 13 Calabrian sources were pre-selected, classified by type (citizens, press, weather) and geographic scope:
| Source | Type | Scope |
|---|---|---|
| Italia Nostra, Sezione Alto Tirreno Cosentino | citizens | Tirreno Nord |
| #marepulito, Golfo di Lamezia inquinato? (group) | citizens | Tirreno Sud |
| Uniti per il Golfo di Sant'Eufemia | citizens | Tirreno Sud |
| Mare Pulito (Association) | citizens | regional |
| Il Lametino | local press | Tirreno Sud |
| Lameziainforma.it | local press | Tirreno Sud |
| StrettoWeb | regional press | regional |
| Gazzetta del Sud | regional press | regional |
| LaC News24 | regional press | regional |
| Quotidiano del Sud, Calabria | regional press | regional |
| Corriere della Calabria | regional press | regional |
| Calabria 7 | regional press | regional |
| Meteolino Fanpage | weather | regional |
The zone-specific citizen sources (Italia Nostra, #marepulito Golfo di Lamezia, Uniti per il Golfo) are the primary signal of the validation: groups founded specifically to monitor the sea of a precise stretch of coast. The press sources and the weather page (Meteolino), all regional, provide corroboration: their posts count toward a zone only when the text names a coastal municipality, so that generic content is not attributed wholesale. Meteolino, added at a later stage, contributed only to Tirreno Nord (eight posts in three years), confirming that a regional page enters the zonal count in a targeted way.
3. Collection method
The Content Library search API is asynchronous: you submit a job with a query and a time window, wait for it to complete on Meta's servers, then download the aggregated results. The query uses boolean operators in symbolic syntax: & for AND, | for OR, single words; phrases are not supported.
The signal terms used in the filter, in OR with one another, are: mucillagine, mucillagini, schiuma, alghe, liquami, chiazza, non balneabile, mare sporco, acqua sporca, mare marrone, acqua marrone, mare torbido, acqua verde, mare verde. Two-word expressions were translated into (word1 & word2) groups.
The whole 2012-2025 extraction was redone in a single coherent pipeline over the 13 sources (same query, same parser, all years), so that the counts feeding the tables, charts and correlations come from the same dataset. A text-only methodology: a post is included if the text (or the image text) contains a signal term. No filter is applied to the images: the unit of analysis is the reproducible "textual report post".
For geolocation, since Facebook posts carry no usable coordinates, the attribution of a post to a TYRN SEA zone follows two rules, in order:
- Municipality in the text: if a Calabrian coastal municipality appears in the text (or in the page name), the zone is that of the municipality.
- Zone of the source: alternatively, if the source is zone-specific (e.g. Italia Nostra Alto Tirreno → Tirreno Nord), the source's zone is used.
Seven municipalities whose names are also common Italian words (Diamante, Paola, Pizzo, Bianco, Ardore, Melissa, Cirò) were excluded from automatic detection on lowercased text: they would have generated false positives (e.g. "vino bianco", white wine, together with "schiuma", foam). This is a coverage loss that has been accepted and openly declared.
4. The catalogue produced
The collection produced a catalogue of 734 relevant posts linked to a zone (plus about 526 posts with a signal term but no municipality in the text, therefore not attributable to a zone, kept but excluded from the zonal counts). Total by zone, 2012-2025:
| Zone | Posts 2012-2025 |
|---|---|
| Tirreno Nord | 306 |
| Tirreno Sud | 368 |
| Estremo Sud | 34 |
| Ionio Sud | 13 |
| Ionio Nord | 13 |
The Tyrrhenian coast turns out to be well covered (over 670 posts between Tirreno Nord and Tirreno Sud); the far south around Reggio and the two Ionian coasts remain underrepresented instead, with only a few dozen posts each. Two distinct causes combine in this figure and must be kept separate. The first is the absence of dedicated local sources equivalent to Italia Nostra Alto Tirreno or #marepulito: no Calabrian Facebook page or group systematically monitors the state of the sea for Reggio Calabria, Crotone, Cirò Marina, Cariati, Locri or Catanzaro Lido. The second, more substantial, is that the Calabrian Ionian coast really suffers far less from mucilage and dirty sea than the Tyrrhenian, as the other strands of this work show. The few Ionian reports are therefore partly a confirmation by absence: not enough to build a statistical test, but enough not to read the zone as a mere "detection gap".
5. The correlation test
For each TYRN SEA zone, the correlation was computed between the yearly number of report posts and the summer SST anomaly (June-August) of the same zone, from the Copernicus reanalysis data used by the index. The main metric is Spearman's rho (ρ), a rank correlation: on short series and on counts where individual years carry strong leverage (typically 2024, a record-hot year), it is more robust than Pearson's r, which we report alongside for transparency. Significance is assessed with a bootstrap 95% confidence interval (5,000 resamples): if the CI crosses zero, the correlation cannot be distinguished from noise.
For each zone the calculation uses the window chosen according to the founding date of the main citizen source. For the Tirreno Nord the full 2012-2025 series is used (the Italia Nostra source is long-standing, with no activation effect); for the other four zones the 2018-2025 window is used (excluding the launch years of the source groups, 2016-2017, which produce a publication peak driven by initial enthusiasm, see ch. 7).
6. Results by zone
Summary table. For each zone: Pearson (r) and Spearman (ρ), the bootstrap 95% confidence interval of the Spearman coefficient, the number of posts in the window, and the robustness. Robustness criterion: Robust if the Spearman CI excludes zero; otherwise Not conclusive (the correlation cannot be distinguished from zero with these data).
| Zone | Period | r (Pearson) | ρ (Spearman) | 95% CI (ρ) | n posts | Robustness |
|---|---|---|---|---|---|---|
| Tirreno Nord | 2012-25 | +0.50 | +0.72 | [+0.22, +0.94] | 306 | Robust |
| Tirreno Sud | 2018-25 | +0.80 | +0.62 | [−0.26, +1.00] | 259 | Not conclusive |
| Estremo Sud | 2018-25 | +0.66 | +0.66 | [−0.08, +0.98] | 29 | Not conclusive |
| Ionio Sud | 2018-25 | +0.43 | +0.39 | [−0.45, +0.92] | 12 | Not conclusive |
| Ionio Nord | 2018-25 | −0.24 | −0.40 | [−0.89, +0.49] | 11 | Not conclusive |
The "n posts" column gives the sums over the correlation window (for Tirreno Nord the whole 2012-25 series, for the others 2018-25) and does not coincide with the zone totals in ch. 4, which cover the entire 2012-2025. A wide CI reflects the limited sample size (8 years for four zones out of five).
Only one zone is robust: Tirreno Nord. It is the only one whose confidence interval stays above zero, thanks to the longest series (14 years) and the highest post volume. On the other four zones the CI contains zero: the sign is positive on Tirreno Sud and Estremo Sud (consistent with the hypothesis), but with 8 years the estimate cannot be distinguished from noise; on the Ionian coast the data is too thin, and Ionio Nord even comes out with a negative sign. A per-zone reading follows.
Tirreno Nord
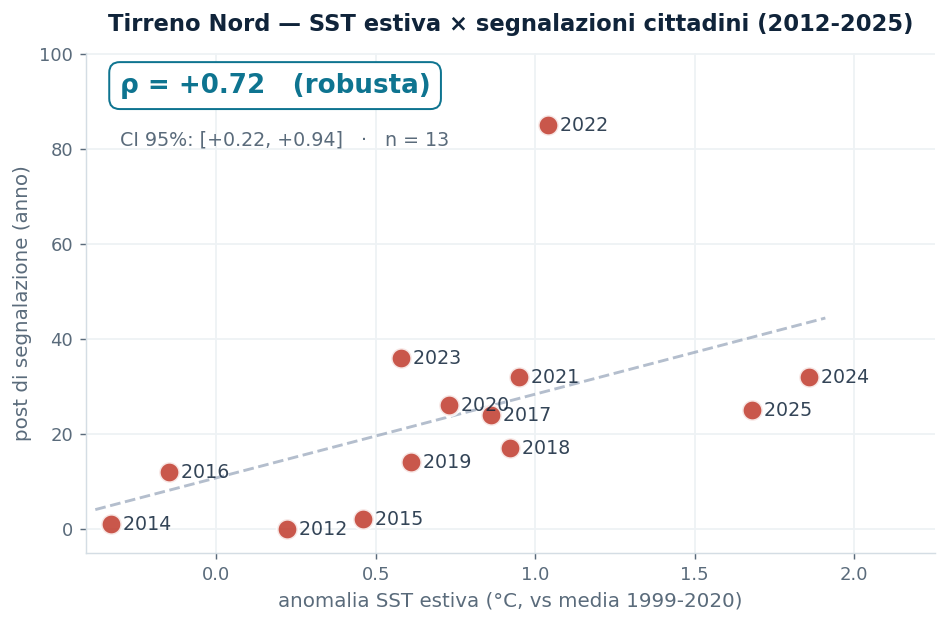
This is the solid result of the work (Spearman ρ = +0.72, 95% CI [+0.22, +0.94]; Pearson r = +0.50) on the full 2012-25 series. The CI stays above zero: the colder years sit low, the warmer ones high, and the warm→reports ordering is regular. This is made possible by the longest series and the highest post volume (306 in the period), together with the fact that the main citizen source, Italia Nostra Alto Tirreno Cosentino, is a long-standing group and is not affected by the activation effect (0-2 posts in the years 2012-2015). The 2022 point stands out (85 posts at +1.04 °C, against 32 in 2024 at +1.86 °C, the warmest year): it reflects a targeted campaign by the association on discharges from a single river, a publication effect not proportional to the warmth. Precisely because Spearman works on ranks, that spike does not distort the conclusion.
Tirreno Sud
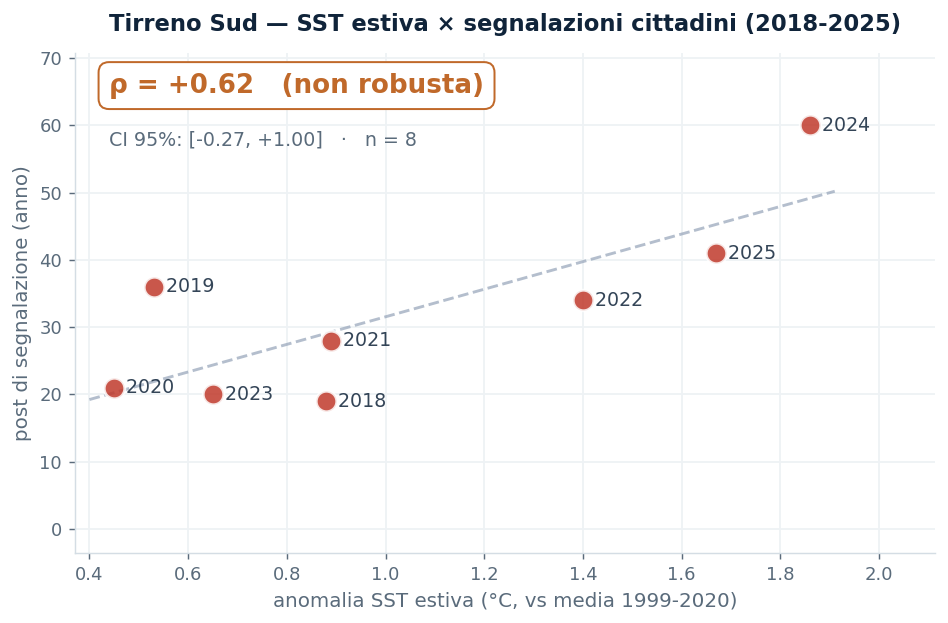
The sign is positive and in the expected direction, but it is not conclusive (Spearman ρ = +0.62, 95% CI [−0.26, +1.00]). Pearson's r rises to +0.80 here, but it is fragile: it is pulled by 2024, the hottest summer on record (+1.86 °C), which records the highest number of reports (60 posts); remove or dampen that point and the estimate collapses, and indeed Spearman and its confidence interval (which crosses zero) show as much. With only 8 years the direction is suggestive, the significance is not. It should not be presented, as the previous version of this page did, as a "strong" correlation.
Estremo Sud
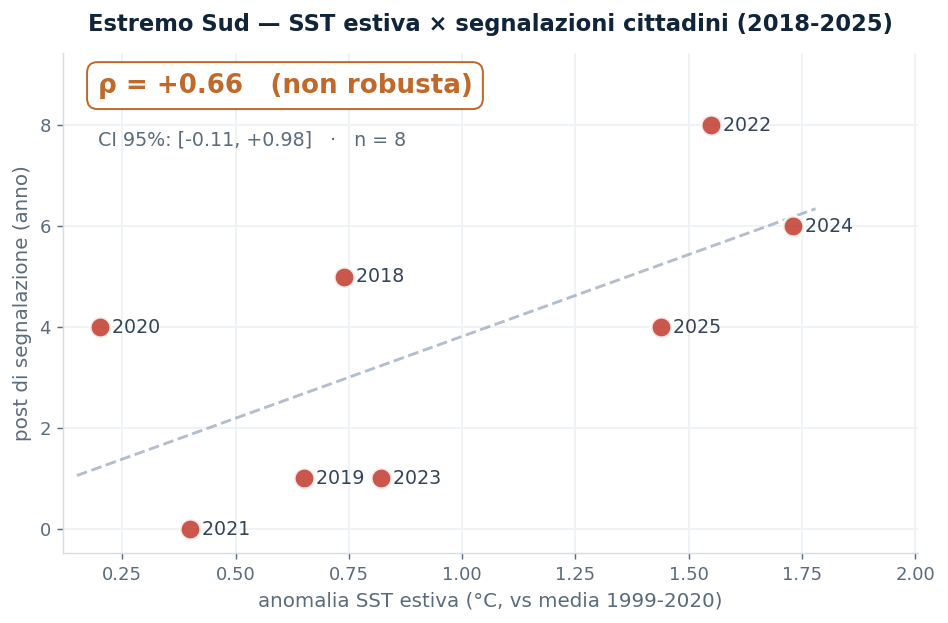
Positive correlation in the point estimate (Spearman ρ = +0.66, Pearson r = +0.66) but not conclusive: the 95% CI [−0.08, +0.98] touches zero in the lower tail. The warmer years (2022, 2024) fall above the median post count, the cooler ones below, but the number of posts in the period is very low (29) and the interval is consequently wide. The zone has no dedicated citizen page: the contribution comes almost entirely from regional press citing Reggio-area municipalities in the text.
Ionio Sud
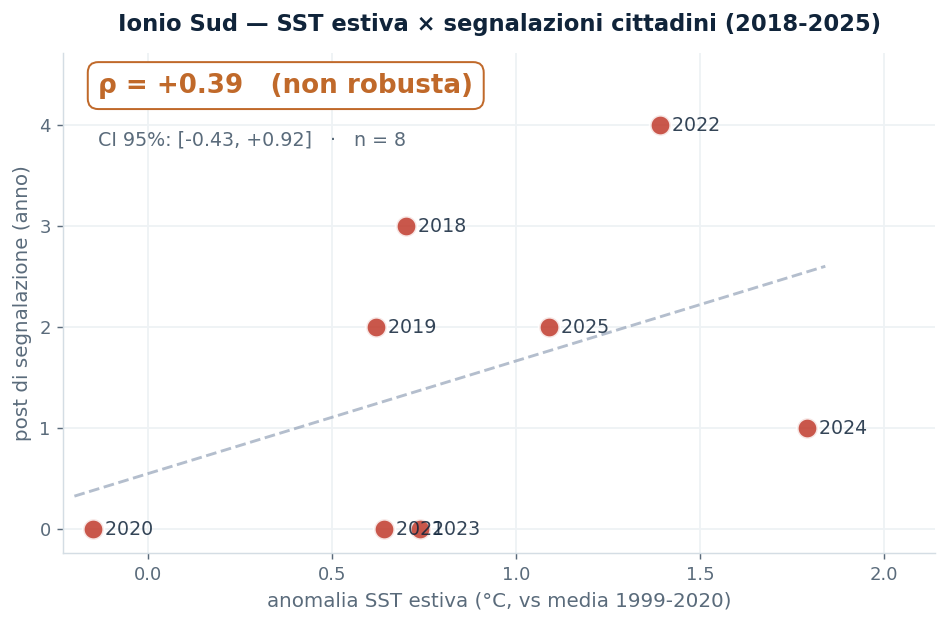
Sample size too small for a test (8 years with counts almost always between 0 and 4 posts, 12 in the whole period). The correlation (Spearman ρ = +0.39, 95% CI [−0.45, +0.92]) is technically positive, but the interval is very wide and contains zero: not distinguishable from noise. The cause is twofold: a dedicated citizen source is missing (Locri, Soverato, Catanzaro Lido) and the physical phenomenon itself is rarer on the Ionian side. The figure is therefore not a pure coverage gap: it is largely a physical fact.
Ionio Nord
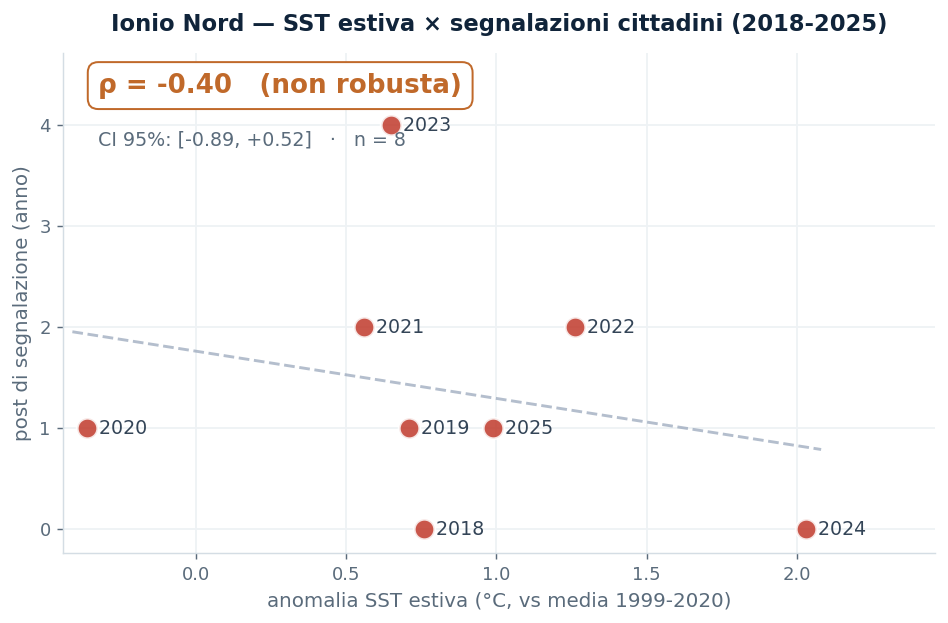
Here the estimate even comes out with a negative sign (Spearman ρ = −0.40, Pearson r = −0.24) and is in any case not conclusive (95% CI [−0.89, +0.49], crossing zero). The counts are uniformly low (11 posts in the whole period): with so few points the estimate is unstable and does not hold up to a test. No citizen page covers Crotone, Cirò Marina, Cariati or Corigliano-Rossano, and on that stretch dirty sea appears rarely, as the temperature and biogeochemistry of the other studies in this series confirm. There is no warm→reports signal here.
7. The Tirreno Sud case: activation effect
One methodological detail deserves explaining. The Tirreno Sud correlation measured over the whole 2012-25 series is close to zero, whereas excluding the years 2016-2017 the point estimate rises (Pearson +0.80, Spearman +0.62). This is what you would expect in the presence of a well-localised confounder.
The most active citizen group for that zone, #marepulito, Golfo di Lamezia inquinato?, was founded on 21 July 2016. The first two years of an environmental watch group typically generate a publication peak (enthusiasm, backlog of complaints, initial virality) that reflects not a climatic event but the birth of the group itself. Excluding those two years is methodologically correct. It must be said clearly, though: even after the exclusion, with only 8 years the Tirreno Sud correlation does not reach significance (the Spearman CI crosses zero). The activation effect explains why the full series is flat; it does not turn Tirreno Sud into a robust result.
8. Examples of reports
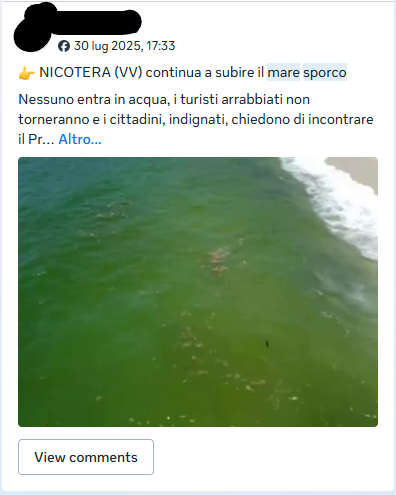
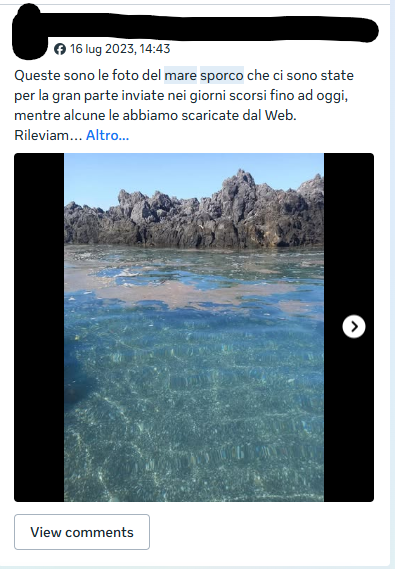
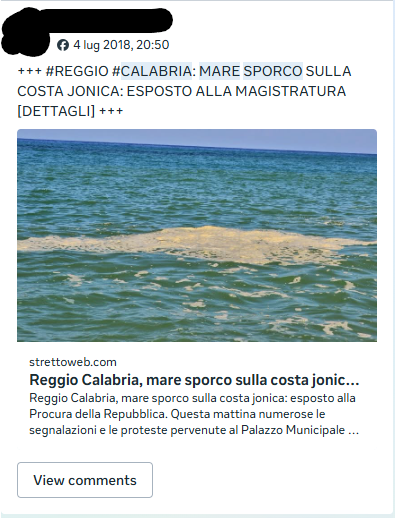
A few real examples, taken from the public posts in the catalogue. The author's name is blacked out; the name of the page or group remains visible, being already public and cited as a source:
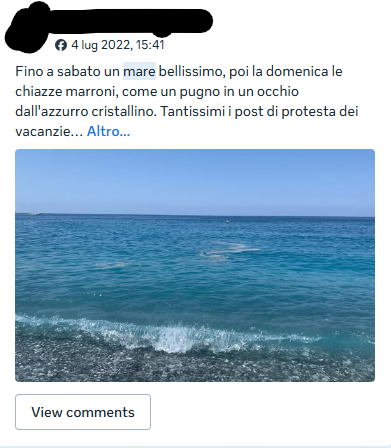
9. Limits
- It is perception, not environment. The post count measures how much people talk about it, not how much dirt there is. In hot years swimmers, beach days, photos and media attention all grow too: these are confounders that push in the same direction as the warmth. The test looks for a consistent signal; it does not prove a causal link.
- One platform only. Facebook only; Instagram, TikTok and Threads are not included.
- Source self-selection. Thirteen sources chosen by editorial criterion (twelve curated plus Meteolino), not a random sample: the validation holds within this set.
- Small samples. Four zones out of five have 8 years of observation and only a few dozen posts: enough to establish the direction, not the significance. Only Tirreno Nord (14 years, 306 posts) can sustain a test.
- Ionian coast: few reports, two reasons. The small number is not just a detection gap: half of it is down to the absence of dedicated citizen groups, and half to the fact that the Calabrian Ionian sea really suffers less from mucilage and dirty sea, as the other strands make clear.
10. Conclusions
The signal is there, but it should be stated with the right measure. The TYRN SEA index, built on physical quantities measured by Copernicus satellites without ever using social data, finds a robust empirical confirmation on one zone, Tirreno Nord: there the hottest summers bring more dirty-sea reports in a statistically solid way (Spearman +0.72, a confidence interval that excludes zero, over 14 years of data).
On the other coasts the picture is weaker and more honest: the sign is positive on Tirreno Sud and Estremo Sud, consistent with the hypothesis, but with 8 years of data the correlation cannot be distinguished from zero; on the Ionian coast the data is too thin, and Ionio Nord shows no positive link at all. So: the cross-domain validation holds where the data allows, and remains suggestive but not conclusive elsewhere.
One underlying caveat still holds: the reports are a perception proxy. The consistency with the warmth is real and, on Tirreno Nord, solid; but a post count is not, on its own, proof of the physical link. It is one piece that fits together with the others in this work, not a verdict by itself.
11. Cross-methodological validation (Round 3)
To test the methodological robustness of the picture built on the curated sources, the same measurement was repeated on a completely different corpus: instead of the selected sources, the entire Italian Facebook archive accessible via Meta Content Library. Same question, open source, automated filters.
Round 3 method
Query with a 3-level AND: (a dirty-sea term in the text) & (a Calabrian geographic reference: municipality, macro-toponym, "Calabria") & (post with an attached photo). No source filter: all of Facebook Italy. search_scope = post_text_only. Lexicon extended to 41 terms (including the hashtags #maresporco, #mucillagini, #scarichiabusivi).
Raw result: 193,222 posts collected over the period 2012-2024. Five progressive filters were applied to the raw set:
| Filter | Surviving posts | % of raw |
|---|---|---|
| B0: raw from the Meta query | 193,222 | 100.0% |
| + on-topic Calabria (municipality or macro-toponym in text) | 136,793 | 70.8% |
| B1: + content_type "photos" (single photo) | 38,268 | 19.8% |
| B2: + non-ambiguous municipality (Palmi/Paola/Diamante/Pizzo/… excluded) | 24,952 | 12.9% |
| B3: + strong complaint term + no commercial sources | 810 | 0.42% |
The final B3 subset contains only posts that have everything: a photo, a specific Calabrian geo-reference, an explicit complaint term, and provenance from a non-commercial source.
Round 3 correlations compared
Comparison of the Pearson point estimates between the two independent extractions (curated sources versus open Facebook). Robustness and Spearman CIs are in ch. 6; here Round 3 is available only as Pearson from its aggregated data.
| Zone | r curated sources | r Round 3 (open) | 95% CI Round 3 | Reading |
|---|---|---|---|---|
| Tirreno Nord | +0.50 | +0.62 | [+0.26, +0.90] | Confirmed (positive in both) |
| Tirreno Sud | +0.80 | +0.72 | [+0.19, +1.00] | Positive in both (but see Spearman CI, ch. 6) |
| Estremo Sud | +0.66 | −0.57 | [−0.95, +0.21] | Not conclusive (opposite sign) |
| Ionio Sud | +0.43 | +0.06 | [−0.95, +0.88] | Not conclusive |
| Ionio Nord | −0.24 | −0.71 | [−0.99, +0.18] | Not conclusive (both negative) |
1. The Tyrrhenian holds up under two independent samplings. Tirreno Nord and Tirreno Sud give a positive sign both on the curated sources and on the whole of Facebook with automated filters: the consistency between two such different procedures is the kind of robustness expected from a cross-methodological validation. The signal on the Tyrrhenian coasts is not an artefact of the editorial selection. The distinction from ch. 6 still holds: only Tirreno Nord is robust to Spearman with a CI as well; Tirreno Sud is consistent in direction but not significant.
2. On the other three zones, n=8 years is too few, even with broader coverage. Round 3 increased the zone-specific posts on Estremo Sud and the Ionian coast, but the confidence intervals remain very wide and cross zero, and on Estremo Sud and Ionio Nord the sign reverses. The bottleneck is not the number of sources but the number of years: 8 years with a few dozen posts are too few to separate the signal from the inter-annual noise.
The methodologically relevant point is that the solid part (Tirreno Nord) holds up to the open-corpus test, and the inconclusive part remains honestly inconclusive, even with more starting data.
Residual limits
- CLIP image filter not executable. The Meta Content Library secure environment is isolated from the network: no pip install, no model downloads. The CLIP filter, planned as a visual refinement, was not applicable. The B3 subset nevertheless has high textual quality because it passes through 5 concatenated filters.
- 50% not geographically attributable. 411 of 810 posts have complaint terms and a generic geo-reference ("Calabria") but no specific coastal municipality: for those the zone is not assigned, and they do not enter the per-zone calculation.
- Unified 2012-2025 extraction. The analysis of the curated sources was recomputed in a single coherent pipeline (13 sources, all years), resolving a previous mismatch between the counts in the tables and those in the charts.