Foreword
This document reconstructs, over 44 years of satellite observations (1982-2025), how the sea surface temperature has changed along the Tyrrhenian coast of Calabria, with a specific focus on the stretch between Amantea and Lamezia. The aim is twofold:
- to provide a quantitative picture of the warming of the sea in the area, reconstructing trends, the seasonal cycle, anomalies and the spatial distribution;
- to assess to what extent the thermal conditions today favour - relative to 40 years ago - events that have concrete repercussions on the ecosystem and on tourism, in particular the formation of summer mucilage.
The document is written in an accessible form: all technical terms and acronyms are explained on first use and collected in a dedicated glossary. All the figures presented derive from processing carried out directly on the public Copernicus Marine data; the methods are described in the dedicated chapter and the processing script is available as a technical appendix, making the analysis fully reproducible.
A note of methodological honesty: sea surface temperature (SST) is an important variable but not the only one that governs the phenomena discussed. In the final chapters the cause-effect links between warming and ecological-economic impacts are presented with the appropriate caveats, distinguishing where possible what our data show from what the scientific literature documents for wider geographical scales.
Glossary of acronyms and technical terms
The main technical terms and acronyms used in the document are listed here.
| Term / Acronym | Meaning |
|---|---|
| SST | Sea Surface Temperature - the temperature of the surface skin of the sea (the first ~1-2 mm of depth), measured by satellites using infrared or microwave sensors. It is the physical quantity at the centre of the whole study. |
| CMEMS | Copernicus Marine Environment Monitoring Service - the European Union's marine monitoring service (Copernicus programme). It freely distributes satellite and model data on the sea. The primary source of this analysis. |
| L4 (Level 4) | A processing level of satellite data. The 'levels' run from L0 (raw data) to L4 (a regular daily map, gap-free, obtained by combining several sensors and interpolating the areas covered by clouds). We use L4 because it covers the whole map every day. |
| OSI SAF | Ocean and Sea Ice Satellite Application Facility - the European centre (a EUMETSAT consortium) that produces the SST data used. It guarantees decadal quality and consistency. |
| Reprocessed (REP) | The 'reprocessed' version of the satellite data: the same algorithms are applied consistently to the whole historical series (1982 to present), so that comparisons between different years are statistically reliable. |
| NRT (Near Real Time) | The version of the data published with a few hours' delay (useful for daily monitoring), statistically less reliable than the reprocessed. |
| WMO | World Meteorological Organization. It defines the international standards, including the convention of using the 30-year period 1991-2020 as the 'reference period' for computing climate anomalies. |
| Climate anomaly | The difference between an observed value and the mean computed over the reference period. E.g.: 2024 summer anomaly = summer 2024 SST minus the mean SST of the summers 1991-2020. It is measured in °C. |
| Reference climatology | The mean computed over a reference period (here 1991-2020) used as the 'normal' against which to measure the deviations. Not to be confused with 'climate' in the general sense. |
| Decade (in a trend) | A 10-year period. A trend expressed in '°C/decade' indicates how much the temperature rises every 10 years. E.g.: +0.5 °C/decade = +2 °C in 40 years. |
| Linear trend | The slope of the line that best approximates the historical series (linear regression). It indicates the mean rate of change. |
| σ (sigma) - standard deviation | A measure of the spread of the data around the mean. '±1σ' represents the band within which ~68% of the values fall in a normal distribution; '±2σ' the ~95%. |
| doy (day of year) | The day of the year expressed as a progressive number from 1 (1 January) to 365 or 366. E.g.: 1 June = doy 152. |
| JJA | The acronym for Jun-Jul-Aug; it denotes the three summer months (June-July-August), conventional in climatology. |
| NetCDF (.nc) | Network Common Data Form: a standard file format in climate research for storing large multidimensional arrays (time × latitude × longitude). |
| MHW (Marine Heat Wave) | A marine heatwave: under the international definition (Hobday et al. 2016), a period of at least 5 consecutive days with SST above the 90th percentile of the climatology, classified into 4 severity categories (I-IV). |
| 90th percentile | The value below which 90% of the historical observations fall. Exceeding the 90th percentile means being among the 10% of warmest days relative to normal. |
| HAB (Harmful Algal Bloom) | An explosive proliferation of a phytoplankton species that produces toxins or harmful effects on the environment and/or on humans. |
| EPS | Extracellular Polysaccharides - complex sugars released by phytoplankton under stress. The chemical basis of mucilage. |
| TEP (Transparent Exopolymer Particles) | Transparent gelatinous particles formed by the aggregation of EPS in water. They are the microscopic 'building block' of mucilage. |
| Posidonia oceanica | A marine plant (not an alga) endemic to the Mediterranean; it forms underwater meadows fundamental to the coastal ecosystem. A species protected at EU level. |
| Gorgonian | Branching cnidarians (relatives of corals) that live on submerged rock walls. Sensitive indicators of thermal stress. Species typical of the Calabrian Tyrrhenian: Paramuricea clavata (red), Eunicella cavolini (yellow). |
| Ostreopsis ovata | A benthic dinoflagellate microalga that produces palytoxin; during summer blooms in Italian seas it can cause respiratory irritation in bathers (a 'toxic aerosol' effect). |
| Thermal stratification | A sea configuration in which a warm, light surface layer floats on a colder, denser deep layer, without mixing. Typical of summer; it favours mucilage, surface oligotrophication and thermal shocks. |
| Thermocline | A transition layer (a few metres thick) in which the temperature drops sharply, passing from the warm surface waters to the cold deep ones. |
| Oligotrophication | A state of low nutrient content (nitrogen, phosphorus) of a water mass. Summer stratification isolates the surface layer and makes it oligotrophic, stressing the phytoplankton. |
| Tropicalisation | The phenomenon by which species typical of warmer seas (tropical, subtropical) expand their range towards the Mediterranean, replacing or joining native species. Accelerated by the warming of the seas. |
| ARPA Calabria | The Regional Environmental Protection Agency of Calabria. It conducts monitoring of coastal waters, including the Ostreopsis surveillance. |
| ISPRA | The Italian Higher Institute for Environmental Protection and Research. The national reference body for Italian environmental monitoring. |
| T-MEDNet | A thermal and biological monitoring network for the Mediterranean, coordinated by the Institut de Ciències del Mar (Barcelona). It documents the effects of warming on the benthic fauna. |
1. Data sources and methodology
1.1 How sea temperature is measured from space
Sea surface temperature (SST) can be measured with three families of instruments:
- buoys and ships (point measurements, but sparse and expensive);
- infrared sensors on board satellites (high spatial resolution, but blocked by clouds);
- microwave sensors on board satellites (they penetrate clouds, but with a coarser spatial resolution).
None of the three solutions on its own produces a complete, continuous and uniform map. For this reason the European centres intelligently combine several satellite sources (the MetOp, NOAA, Suomi-NPP, MSG missions), producing an integrated product called 'Level 4' (L4). An L4 datum is a daily map of the entire Mediterranean, gap-free (the system statistically interpolates the areas covered by clouds using the data of nearby days and of complementary satellites) and with a spatial resolution of about 1 km × 1 km.
To obtain a historical series usable for climate analyses, the L4 algorithms must be applied consistently to the whole satellite history; this product is called 'reprocessed' (REP). Without the reprocessing, comparing the temperature of 1985 with that of 2024 would be like comparing a measurement made with a thermometer of one brand with one made with a thermometer of another brand: the data would not be directly comparable.
1.2 The dataset used
For this analysis the following dataset was used:
SST_MED_SST_L4_REP_OBSERVATIONS_010_021
This is the official Copernicus Marine product for Mediterranean SST, Level 4, reprocessed version. Its technical characteristics are:
| Characteristic | Value |
|---|---|
| Geographical coverage | The whole Mediterranean Sea |
| Period covered in this analysis | 1 January 1982 - 31 December 2025 (44 complete years, 16,071 days) |
| Latest date available in the REP dataset | Updated to the Copernicus spring 2026 release: it reaches 31/12/2025 (an effective lag of ~4-5 months relative to today) |
| Spatial resolution | ~1 km (0.01° in latitude and longitude) |
| Temporal resolution | 1 map per day (daily mean datum) |
| Variable measured | Temperature of the surface skin (in Kelvin) |
| Sensors used | A multi-satellite combination (NOAA AVHRR, MetOp, Sentinel, MSG) |
| Algorithm | OSI SAF L4 with adaptive gap-filling based on neural networks |
| Stated accuracy | Typical error ~0.2-0.3 °C relative to in situ measurements |
| Availability | Free upon registration at marine.copernicus.eu |
1.2bis Reprocessed (REP) vs Near Real Time (NRT): two complementary datasets
Copernicus distributes two versions of the same Mediterranean SST datum, with complementary characteristics. It is worth clarifying the difference, because it has operational implications both for this historical analysis and for the real-time monitoring proposals described in the final chapter.
| Code | REP (Reprocessed) | NRT (Near Real Time) |
|---|---|---|
| Product code | SST_MED_SST_L4_REP_OBSERVATIONS_010_021 | SST_MED_SST_L4_NRT_OBSERVATIONS_010_004 |
| Temporal coverage | 1982 - 2025 (grows ~6 months at a time) | 2008 - yesterday (~24 hours of lag) |
| Algorithm | Definitive, applied consistently to the whole series | Provisional, subject to small later corrections |
| Statistical reliability for multi-decadal trends | High - optimised for historical consistency | Low - does not guarantee consistency with the historical series |
| Usefulness for daily alerts / operational monitoring | Low - too delayed | High - updated daily |
| Use in this report | The whole historical analysis 1982-2025 (trends, climatology, maps, MHW, mucilage) | Not used (proposed for a future extension in Chapter 5.3) |
The operational choice is therefore to use REP to build, once and for all, the 'climate snapshot' (the reference climatology + the 90th-percentile thresholds for each day of the year) and then to compare the daily NRT data against these pre-computed thresholds. When Copernicus publishes new blocks of REP (which it does roughly every 6 months), the historical archive can be updated - a non-urgent operation, because it serves only to extend the long-term charts.
1.3 Processing chain used
The data were downloaded and analysed with a Python script that carries out, in an automated and reproducible way, the following steps:
- Authentication on the Copernicus Marine service through user credentials (registration is free).
- Definition of two areas of interest (geographical 'boxes'):
Box 1 - extended Calabrian Tyrrhenian coast: from Praia a Mare to Scilla (lat 38.25°N - 39.95°N, lon 15.60°E - 16.30°E);
Box 2 - Amantea-Lamezia stretch (focus): lat 38.88°N - 39.18°N, lon 15.90°E - 16.28°E.
- Download via API of the data subset relating to the two boxes, for the whole period 1 January 1982 - 31 December 2025 (a total of about 64 MB of NetCDF).
- Conversion from Kelvin to Celsius (subtracting 273.15).
- Computation of the spatial mean for each box and for each day, obtaining a daily time series of SST 'representative' of the box.
- Aggregation on an annual and seasonal scale (summer means, June-August).
- Computation of the anomalies relative to the 1991-2020 climatology (WMO standard).
- Computation of the linear trends (least-squares regression).
- Production of spatial maps of the recent decadal anomaly (2015-2024 vs 1991-2020).
- For the Amantea-Lamezia box: computation of specific indicators for the mucilage preconditions (see Part 2).
1.4 Climatological reference (1991-2020)
All the anomalies and deviations presented are computed relative to the mean of the 30-year period 1991-2020. This choice follows the convention of the World Meteorological Organization (WMO) which, since 2021, recommends the use of this period as the reference 'climate normal'. It is important to stress one point:
The 1991-2020 period already includes a significant portion of the ongoing global warming. Comparing against this 'normal' therefore means measuring how far we are above an already warm baseline - the real anomalies relative to the pre-industrial climate, or even just to the 1980s, would be significantly larger.
1.5 Reproducibility
The whole process is contained in the Python script sst_calabria.py (about 270 lines of commented code). The script saves the downloaded data locally in NetCDF format, so that subsequent reprocessing does not require new downloads. All the charts, CSV tables and maps presented in this report are generated directly by this script, guaranteeing consistency between the figures cited in the text and what is seen in the images.
2. SST trend and ecological impacts on the Calabrian Tyrrhenian coast (1982-2025)
2.1 The key figures
The analysis of the 44 years of satellite observations returns a clear picture: the sea in front of the Tyrrhenian coast of Calabria has warmed significantly and in a statistically robust way, with a marked acceleration in the last decade. The following table summarises the main indicators for both study areas.
| Indicator | Tyrrhenian coast (Praia → Scilla) | Amantea-Lamezia focus |
|---|---|---|
| Mean annual SST trend | +0.30 °C / decade | +0.31 °C / decade |
| Mean summer SST trend (JJA) | +0.52 °C / decade | +0.53 °C / decade |
| Mean annual SST 1982 | 19.65 °C | 19.64 °C |
| Mean annual SST 2024 (record) | 21.33 °C | 21.33 °C |
| Summer anomaly 2024 (record) | +1.97 °C | +2.00 °C |
| Summer anomaly 2025 | +1.79 °C | +1.77 °C |
| Coldest year (summer anomaly) | 1984 (-1.78 °C) | 1984 (-1.86 °C) |
| Overall change 1982 vs 2024 | +1.68 °C (annual) | +1.69 °C (annual) |
Two operational observations emerge straight away from the table:
- Summer warms almost twice as fast as the annual mean: 0.52 °C/decade against 0.30 °C/decade. This is consistent with the scientific literature on the Mediterranean, identified as one of the main global climate 'hotspots': summer stratification concentrates the warming in the surface layer, whereas in winter the mixing attenuates the phenomenon.
- The two study areas are practically identical in trend and mean values. This means that the warming is a regional phenomenon, not linked to local specifics (currents, point discharges, etc.). The Amantea-Lamezia stretch behaves exactly like the Calabrian Tyrrhenian average.
2.2 Long-term trend: 44 years of observations
Figures 1 and 2 show the year-by-year evolution of the mean annual SST (blue line) and of the mean summer SST (red line, June-August), together with the linear regression line that quantifies the tendency. The lower panel of each figure reports the summer anomaly of each year relative to the 1991-2020 climatology: red bars for years warmer than normal, blue bars for colder years.
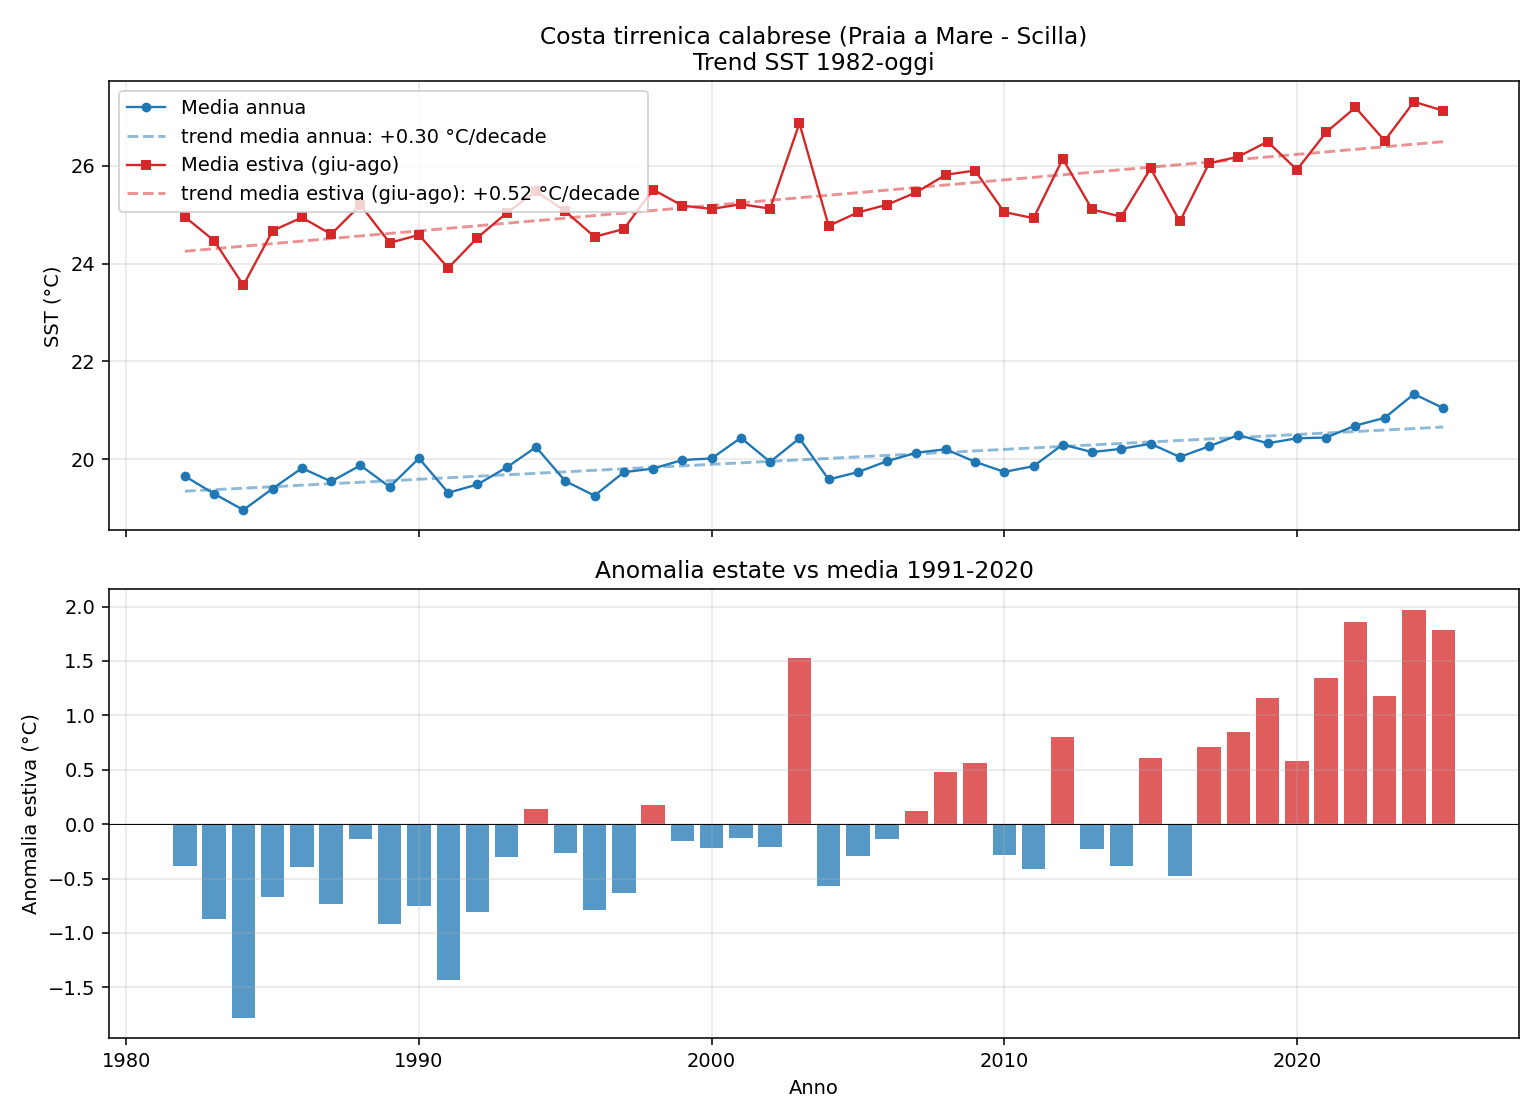
Figure 1 — Calabrian Tyrrhenian coast (Praia a Mare → Scilla). Top: mean annual SST (blue) and mean summer JJA SST (red), 1982-2025, with dashed linear-regression lines. Bottom: summer anomaly year by year relative to the 1991-2020 mean. The red bars represent summers warmer than normal, the blue ones colder.
How to read the chart
The upper panel tells how warm the sea is each year, separating the annual mean and the summer mean. The dashed lines are the 'trends': the mean rate at which the temperature rises. The blue line (annual mean) rises by 0.30 °C every 10 years, the red line (summer mean) rises by 0.52 °C every 10 years - almost double the growth. Over 44 years, this means that summers are on average about 2.3 °C warmer than at the start of the series.
The lower panel - the bars - helps to see clearly when the warming becomes the rule and not the exception. Three distinct phases are visible:
- 1982-1997 (the 'cold' phase): blue bars predominate (summers below average), with two striking negative peaks: 1984 (-1.78 °C) and 1991 (-1.43 °C);
- 1998-2014 (transition): the bars oscillate around zero. A famous exception: the summer of 2003 (+1.53 °C), the year of the great European heatwave that caused thousands of deaths in France and Italy;
- 2015-2025 (the 'persistent warm' phase): practically all the bars are red, with increasing anomalies. The last 5 summers all have an anomaly above +1 °C - a condition never observed before in the data. 2024 marks the absolute record of the series (+1.97 °C on the Tyrrhenian coast, +2.00 °C in the Amantea-Lamezia focus).
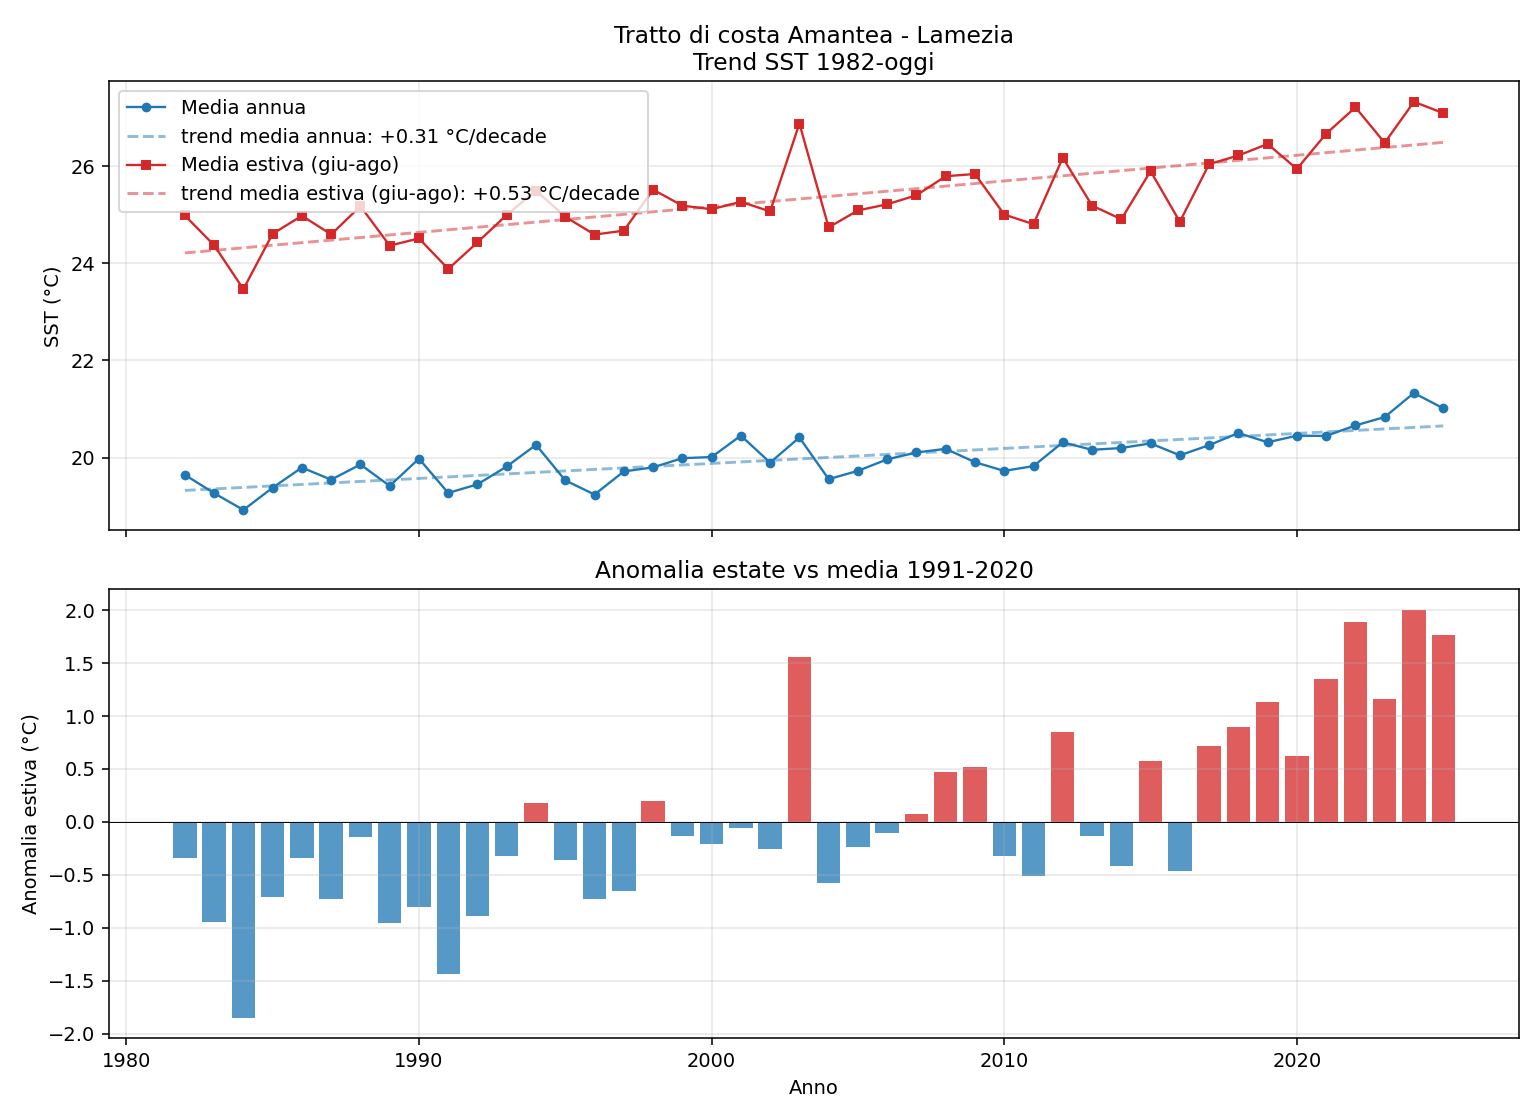
Figure 2 — The same chart as Figure 1 but referring only to the Amantea-Lamezia stretch (focus area). The values and trends are practically identical to the regional ones, a sign that the warming is a widespread and not a local phenomenon.
2.3 Seasonal comparison: how the summer has changed
Knowing that the summer mean has risen by 2 °C says a lot in climatic terms, but it does not tell how that change is distributed within the summer. Figure 3 shows the 44 summer curves (1 June - 30 September) overlaid: each line is one year, coloured according to a purple → yellow colour gradient (purple = older years, yellow = recent years). The 5 most recent curves are highlighted in bold.
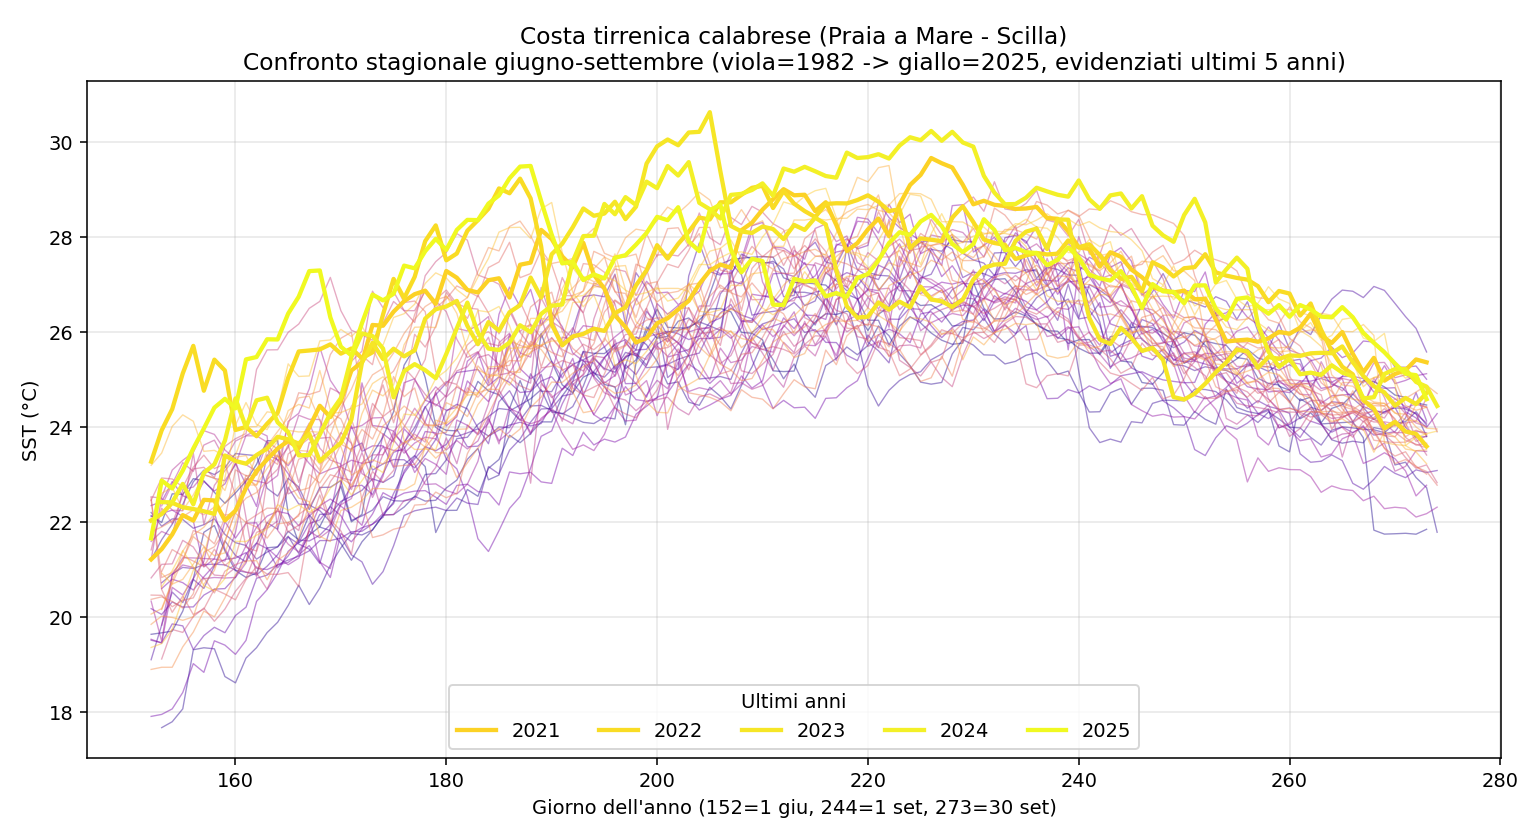
Figure 3 — Calabrian Tyrrhenian coast: comparison of the June-September summer curves for each year from 1982 to 2025. The colour gradient runs from purple (older years) to yellow (more recent years). The last 5 seasons are highlighted with greater thickness.
How to read the chart
The main message of this chart is visual even before it is numerical: the yellow curves (recent years) lie systematically above the purple curves (old years). This means that no day of the summer of the recent years is 'like a day of the summer of the 1980s'.
Three operational details:
- The summer peak: in the past it was typically in the first half of August, with SST around 25-26 °C. Today the peak is in mid-to-late August, around 27 °C, with spikes above 28 °C on isolated days.
- The end-of-summer tail: in the past the sea began to cool rapidly from September. Today the SST stays above 26 °C until mid-September and above 24 °C until almost October. The 'warm sea' season has lengthened by 3-4 weeks.
- The start of summer: June too warms earlier. The SST today reaches 23 °C as early as the first days of June, whereas up to the 1990s this threshold was typically reached around 20-25 June.
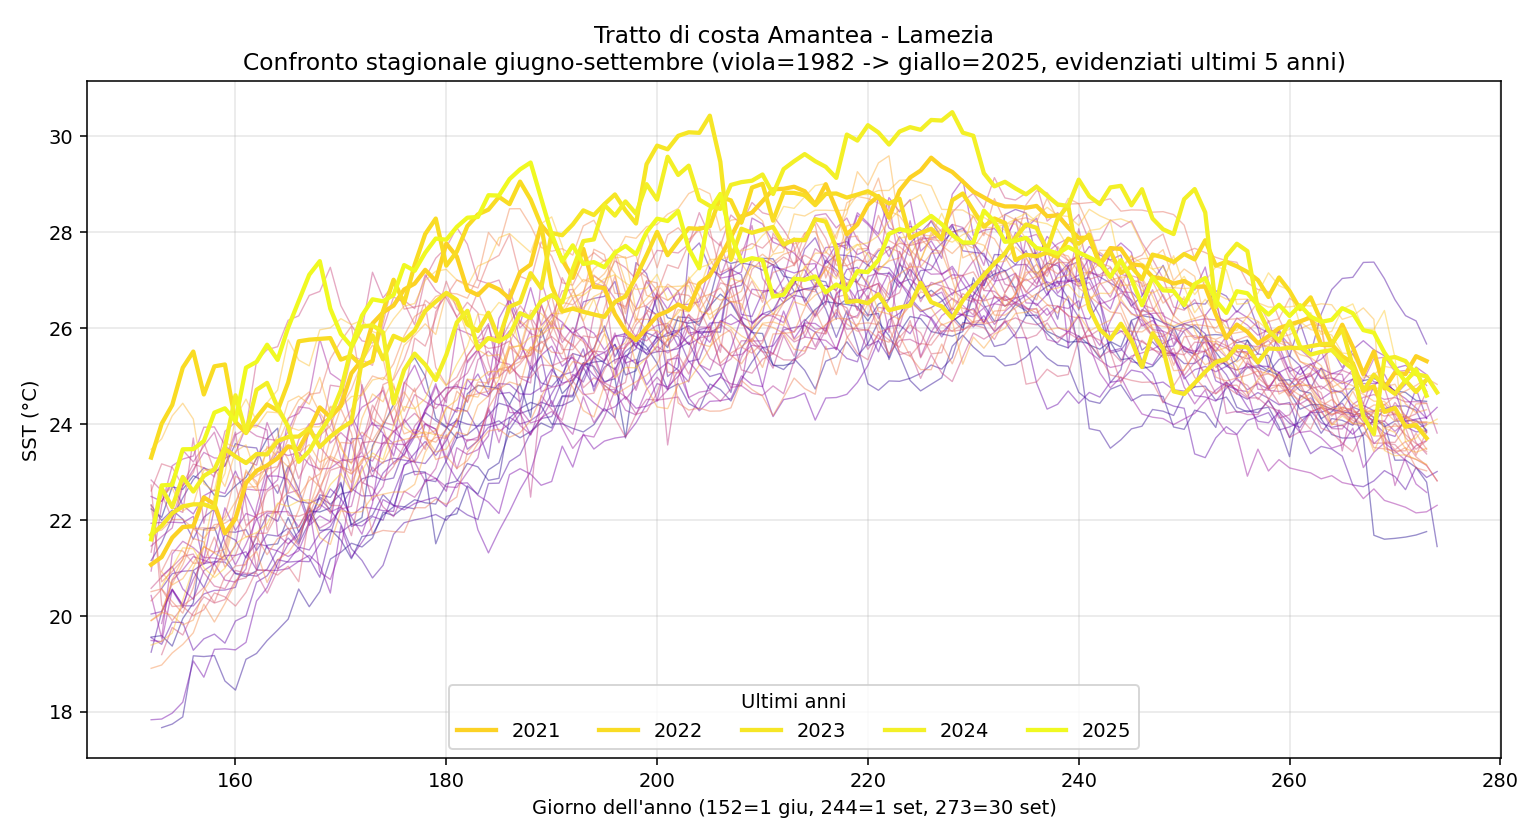
Figure 4 — Seasonal comparison for the Amantea-Lamezia stretch alone. The pattern is entirely analogous to the previous figure.
2.4 Spatial distribution: where does Calabria warm the most?
Figures 5 and 6 are anomaly maps. They compare the mean temperature of the recent decade (2015-2024) with the 1991-2020 climatology, showing how much warmer the sea is at each point of the coast. Dark red indicates positive anomalies (warmer sea); white would indicate no change; blue - absent from our maps - would indicate cooling.
The maps are deliberately drawn over the whole of Calabria, with the coastline, the provincial capitals (in yellow: Cosenza, Catanzaro, Reggio Calabria, Crotone, Vibo Valentia, Lamezia Terme) and the main Tyrrhenian coastal towns (in white). The yellow box highlights the Amantea-Lamezia stretch on which the detailed analysis was focused. The blue dashed box (in Figure 5) highlights the extended data box of the analysed Tyrrhenian coast.
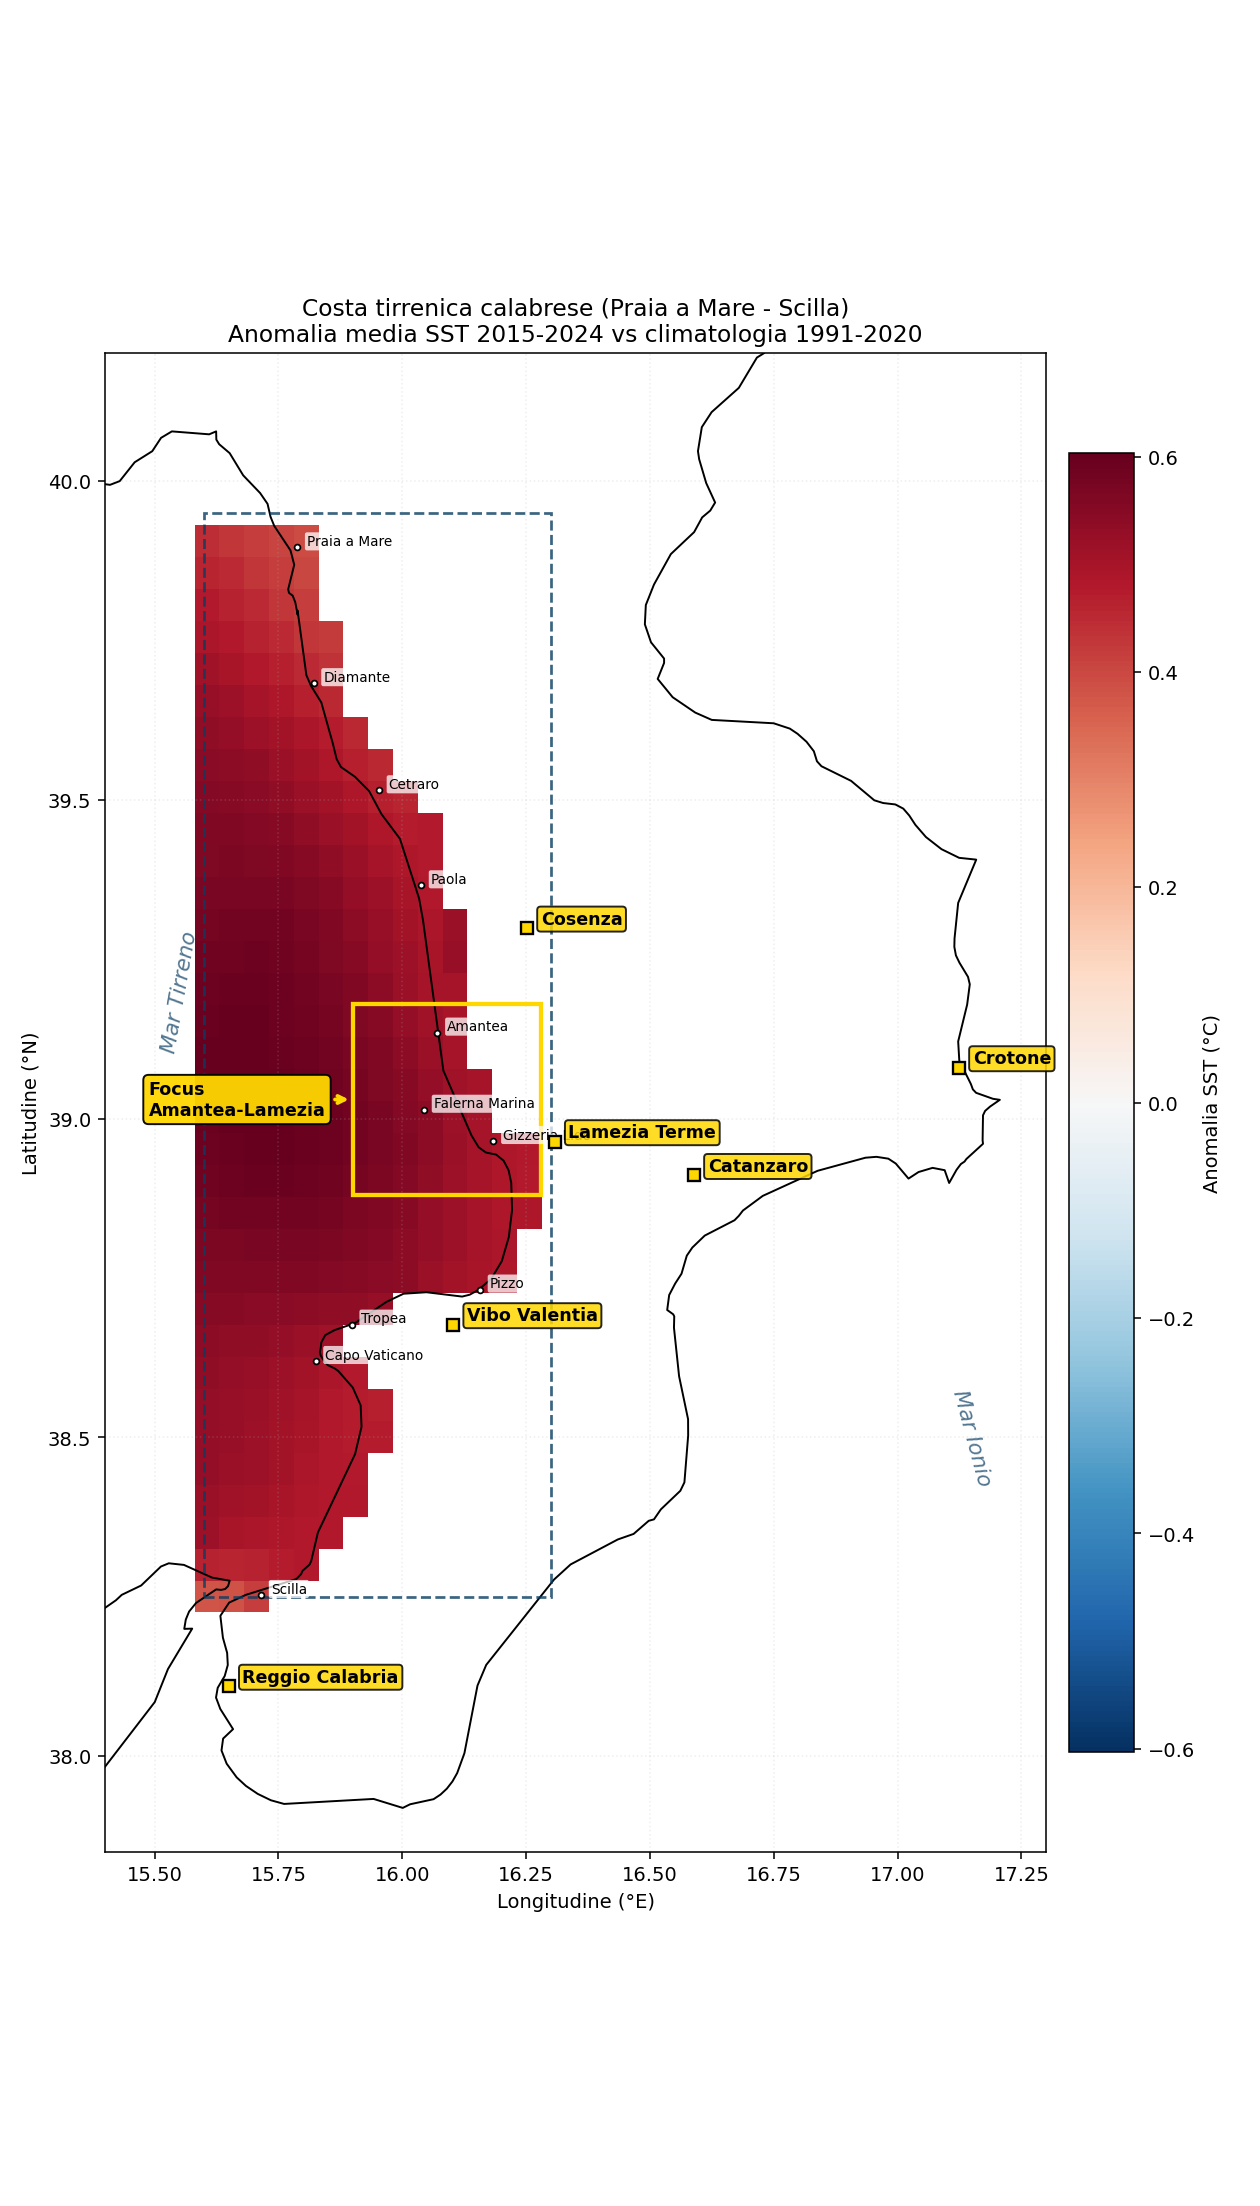
Figure 5 — Map of the mean SST anomaly 2015-2024 relative to the 1991-2020 climatology on the Calabrian Tyrrhenian coast. The blue dashed box delimits the analysed domain; the yellow box highlights the Amantea-Lamezia focus. The colour scale runs from blue (cooler waters) to dark red (warmer waters): in our map everything is in red shades, a sign of uniform warming along the whole coast.
How to read the map
The uniform colour is the first thing to notice: the whole Tyrrhenian coast of Calabria is reddened by about +0.5 / +0.6 °C, with no cooler zones that could act as a 'refuge'. There are no cooler marine microclimates within the analysed range. The zone of most intense colour (the highest anomaly) corresponds precisely to the Gulf of Sant'Eufemia, onto which the stretch from Amantea to Lamezia faces.
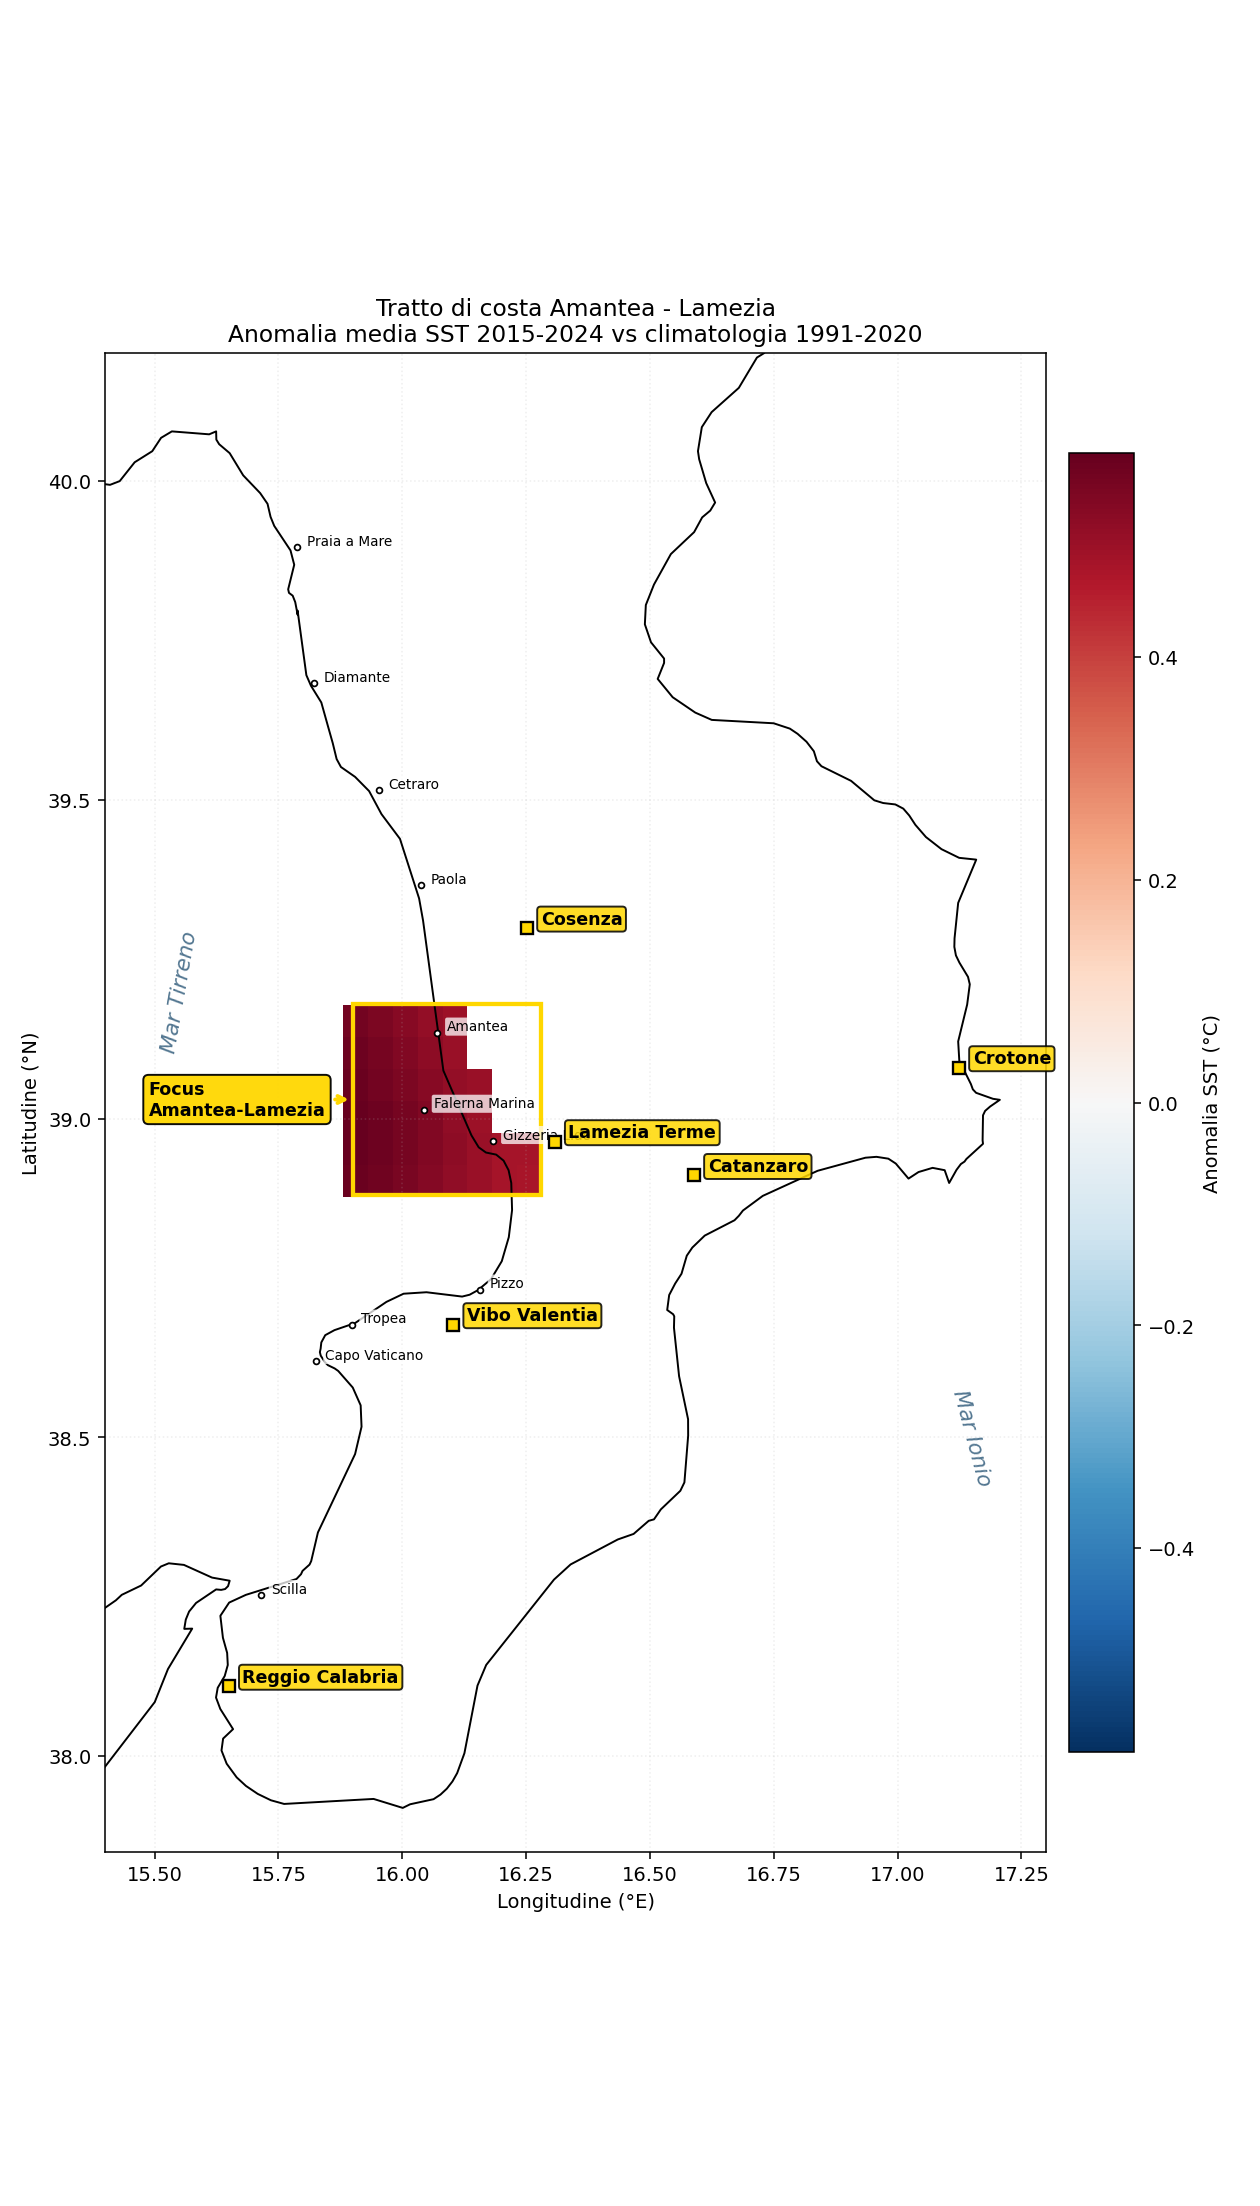
Figure 6 — The same representation as Figure 5, but with data available only for the restricted box of the Amantea-Lamezia focus. The regional context (coastline, provincial capitals, the Tyrrhenian and Ionian seas) is kept identical to facilitate geographical orientation.
Having the context of the whole of Calabria is important so as not to interpret the analysis zone in a misleading way. Close-up maps, lacking the coast and cities, can give the impression that the phenomenon is concentrated in a small area; the regional-scale maps clarify instead that the Amantea-Lamezia datum is part of a much wider picture.
2.5 Notable events of the historical series
To give names and dates to the statistical means, it is useful to list the years that deviated most markedly from the 1991-2020 climatological mean over the 44 years of the historical series. The following table combines summer anomalies (June-August) and annual anomalies to identify the 'off-the-scale' years in both directions.
| Year | What happened | Key anomaly | Notes |
|---|---|---|---|
| 1984 | Coldest summer of the series | -1.78 °C (summer) | The reference year for 'cold' conditions in the series |
| 1991 | Second-coldest summer | -1.43 °C (summer) | The last year clearly below the historical mean |
| 1994 | First significant warm summer | +0.14 °C (summer) | The start of the transition towards the 'warm' regime |
| 2003 | European heatwave (air too) | +1.53 °C (summer) | The year of the great continental heatwave; the first big 'jump' out of the historical envelope |
| 2007 | Very warm summer | +0.12 °C (summer) | Early stratification, top 3 for the mucilage index |
| 2012 | Isolated peak of the 2010s | +0.80 °C (summer) | Confirmation of the new warm regime |
| 2018 | Generalised warming | +0.85 °C (summer) | Warm May, gorgonian events documented in the western Mediterranean |
| 2022 | Intense summer marine heatwave | +1.86 °C (summer) | Widespread gorgonian mortality events in the NW Mediterranean; maximum daily anomaly +4.04 °C |
| 2023 | Record year up to that point | +1.17 °C (summer) | Maximum daily anomaly +4.24 °C (absolute record) |
| 2024 | Warmest summer of the series | +1.97 °C (summer) | Record mean annual SST (21.33 °C); 275 MHW days |
| 2025 | Confirmation of the new regime | +1.79 °C (summer) | May +1.35 °C (record); max anomaly +4.15 °C |
Reading. All the years 'off the scale in the cold direction' are concentrated in the 1980s and the first half of the 1990s; all the years 'off the scale in the warm direction' are concentrated in the last 25 years, with a clear acceleration from 2018 onwards. The maximum daily anomalies shown (+4 °C and above) are particularly relevant because they represent the days of acute thermal stress, those that actually trigger ecosystem mortality.
3. Ecological implications of the warming
The warming of the sea does not manifest itself gradually, but through acute episodes (marine heatwaves) and structural changes (species regressions, tropicalisation, algal blooms). This chapter reviews the impacts documented at the Mediterranean level and how plausible they are for the Calabrian Tyrrhenian coast in the light of the data collected.
3.1 Marine heatwaves (MHW): quantification on our data
Technical definition
A marine heatwave (MHW) is defined - according to the international convention of Hobday et al. (2016) - as a period of at least 5 consecutive days in which the SST exceeds the 90th climatological percentile, that is the value reached only on the 10% warmest days of the reference period (here 1991-2020). The climatology and the 90th-percentile threshold are computed day by day of the year and smoothed with an 11-day moving window to avoid artificial discontinuities.
MHW are the main mechanism through which the warming translates into ecosystem mortality: the stress does not come from the higher mean in itself, but from acute episodes of 1-4 weeks (or more) in which the temperature exceeds the physiological tolerance threshold of organisms and ecosystems.
Intensity categories (Hobday et al. 2018):
| Cat. | Name | Definition | Typical effect |
|---|---|---|---|
| I | Moderate | Anomaly between 1× and 2× the difference between the 90th percentile and the climatology | Noticeable but rarely lethal thermal stress |
| II | Strong | Anomaly between 2× and 3× the threshold-climatology difference | Significant physiological stress for sensitive species |
| III | Severe | Anomaly between 3× and 4× | Documented mortality of gorgonians, posidonia, sponges |
| IV | Extreme | Anomaly above 4× the threshold-climatology difference | Mass mortality events, coral bleaching, profound alterations |
Results of the MHW analysis on the Amantea-Lamezia stretch
Applying the Hobday methodology to our 1982-2025 series, 120 distinct MHW events were identified. Their distribution over time, their annual frequency and their intensity are shown in Figure 7.
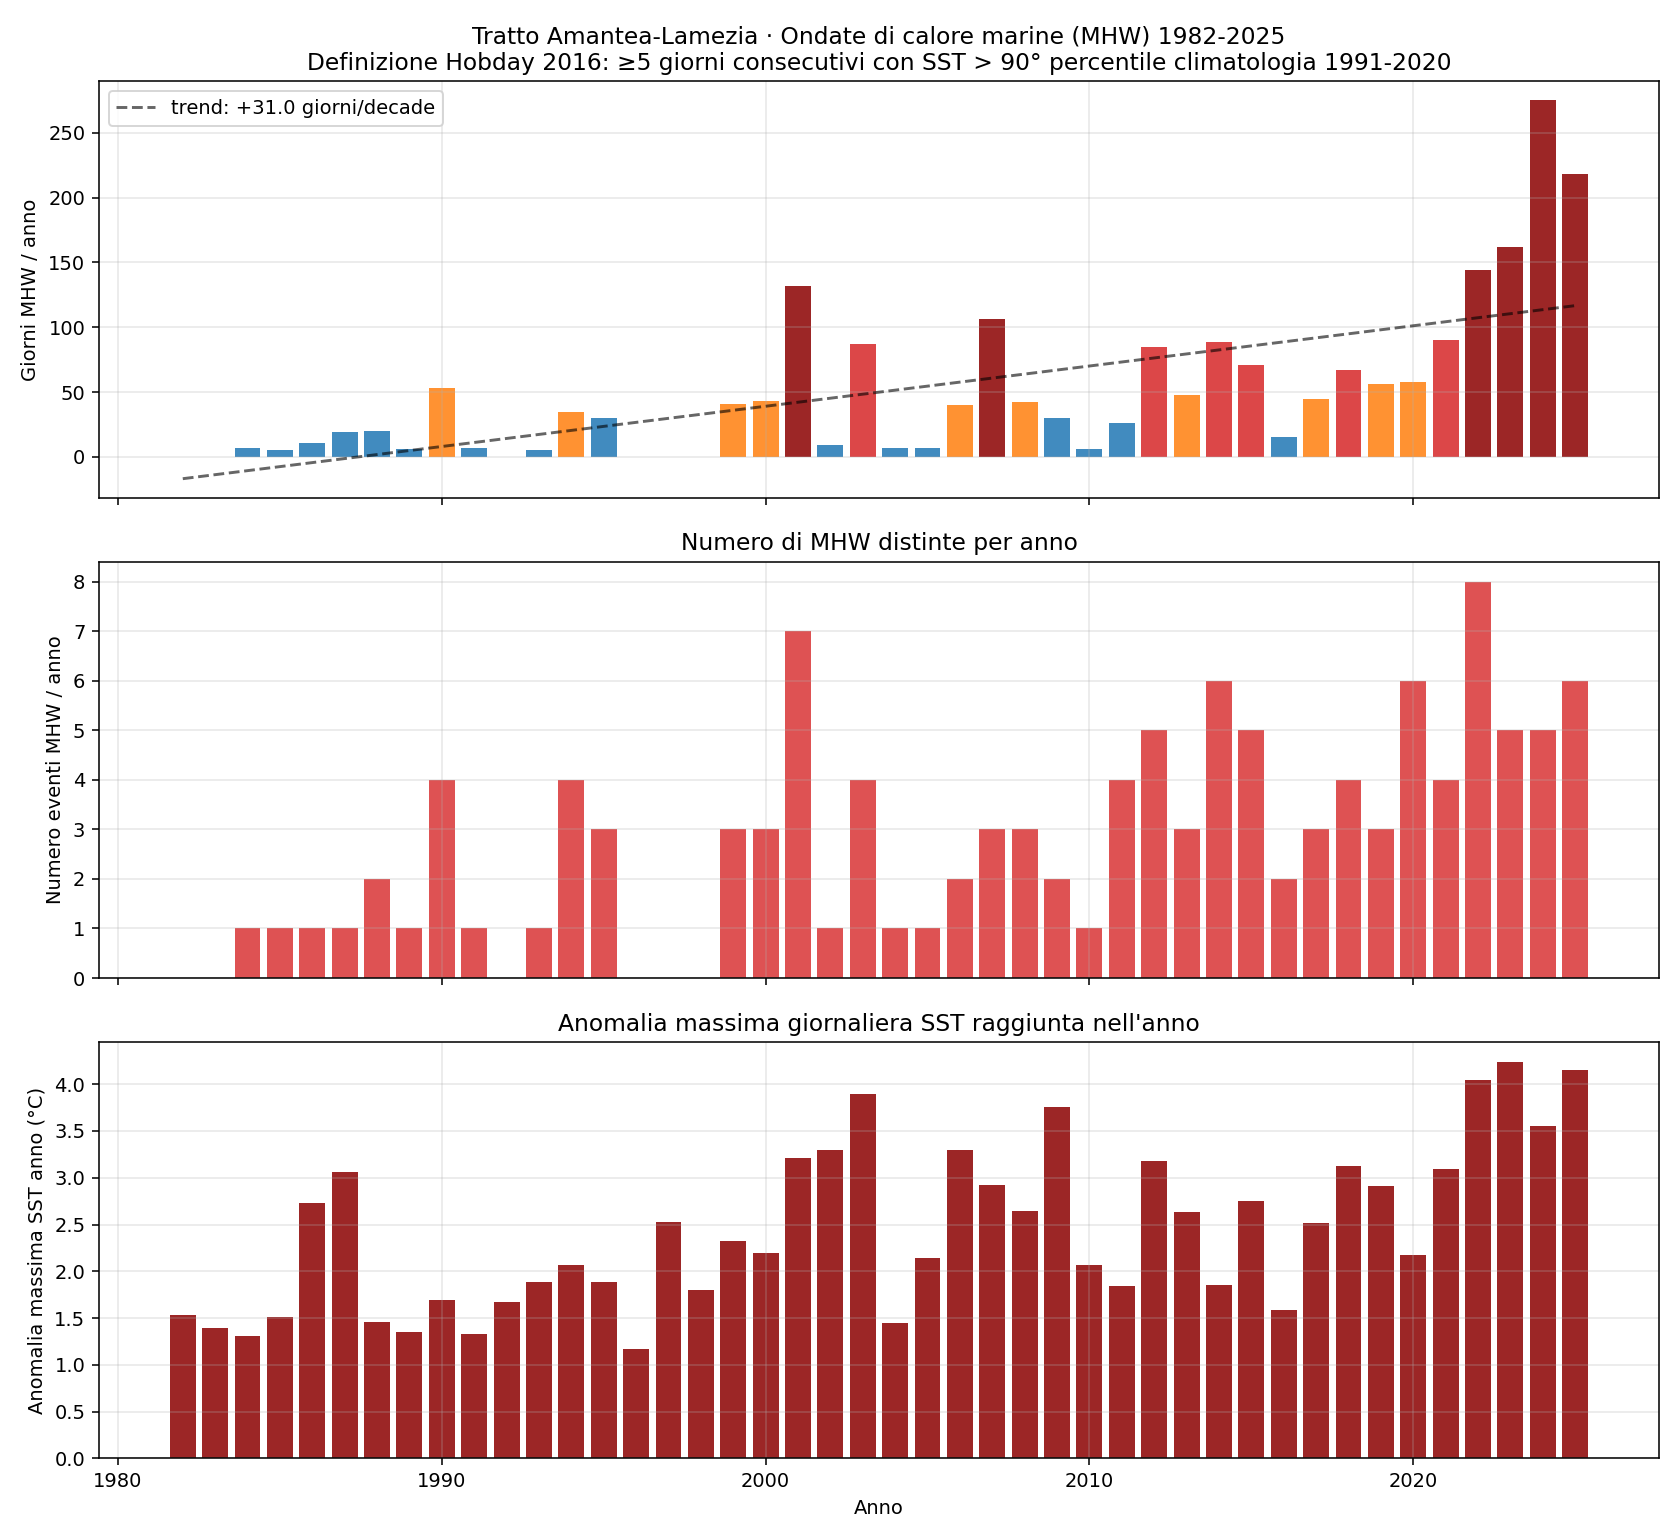
Figure 7 — Marine heatwaves (MHW) on the Amantea-Lamezia stretch, 1982-2025. Upper panel: total MHW days per year (blue = 0-30 days, orange = 30-60, red = 60-90, dark red >90); dashed line = linear trend. Central panel: number of distinct MHW events per year. Lower panel: maximum daily anomaly reached in the year (°C above the climatology).
How to 'see' a marine heatwave: the anatomy of 2024
For those unfamiliar with the technical definition, Figure 8 is the most intuitive way to understand what an MHW is. On the same chart three curves referring to the Amantea-Lamezia stretch are plotted:
- Blue line: the mean daily climatology 1991-2020 - that is, the 'expected temperature' of the sea on each day of the year, computed over the 30-year reference period.
- Orange dashed line: the 90th-percentile threshold - the value that historically was exceeded only on the 10% warmest days. When the daily SST exceeds this line, we are formally in an MHW state (provided the exceedance lasts ≥5 days).
- Dark red line: the daily SST actually observed in 2024.
The areas coloured red highlight the days on which the sea went above the MHW threshold. Very few days of 2024 were NOT in this condition.
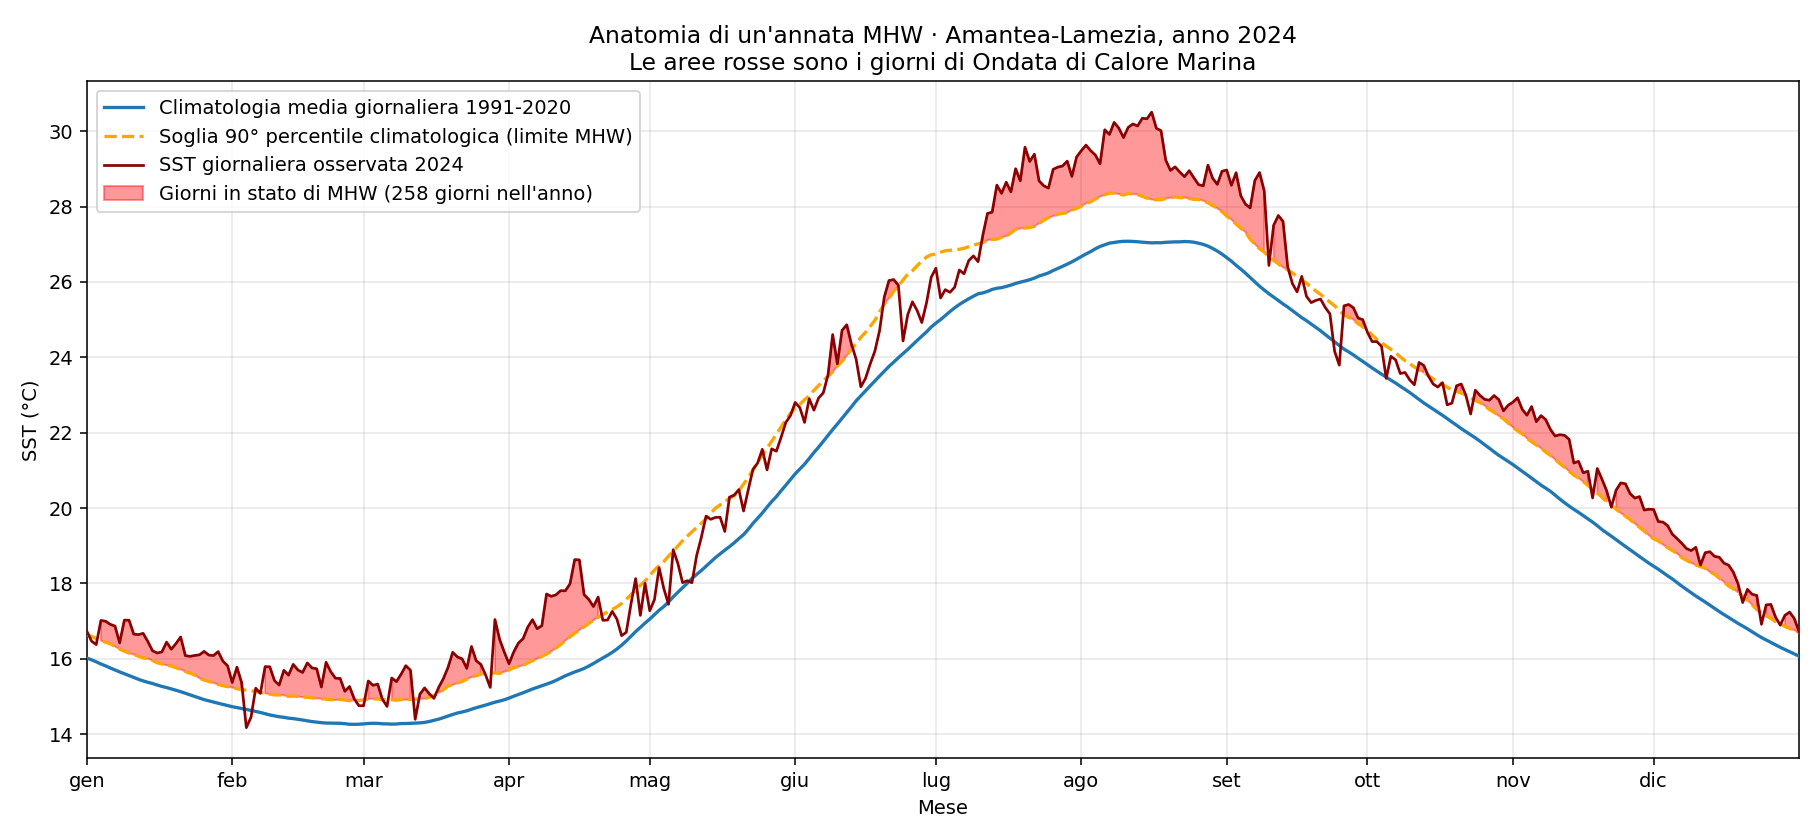
Figure 8 — Anatomy of the year 2024 on the Amantea-Lamezia stretch. The blue curve is the expected climatology, the orange dashed one is the 90th-percentile threshold (the upper limit of the 'climate normal'), the dark red one is the SST observed in 2024. The areas coloured red are the days on which the SST exceeded the threshold: visually they represent the 'amount of heatwave' the sea underwent.
The chart clarifies a central point: an MHW is not a one-off event, it is a condition the sea passes through for long periods. In 2024 the SST was practically always above the climatology (the red line almost always above the blue line), and for most of the year also above the 90th-percentile threshold. The summer (June-September) shows a peak with SST up to above 30 °C, well above the expected threshold of ~28 °C. But the striking figure is the persistence of the anomaly in autumn and winter too - a sign that the thermal imbalance is chronic, not episodic.
Monthly distribution of the MHW: a panoramic view over 44 years
Figure 9 summarises the whole historical series in a single chart: a heatmap in which each cell represents one month of one year, coloured according to the number of MHW days recorded in that month. The colour runs from white (zero days) to black (a month entirely in MHW). The more recent years are at the top.
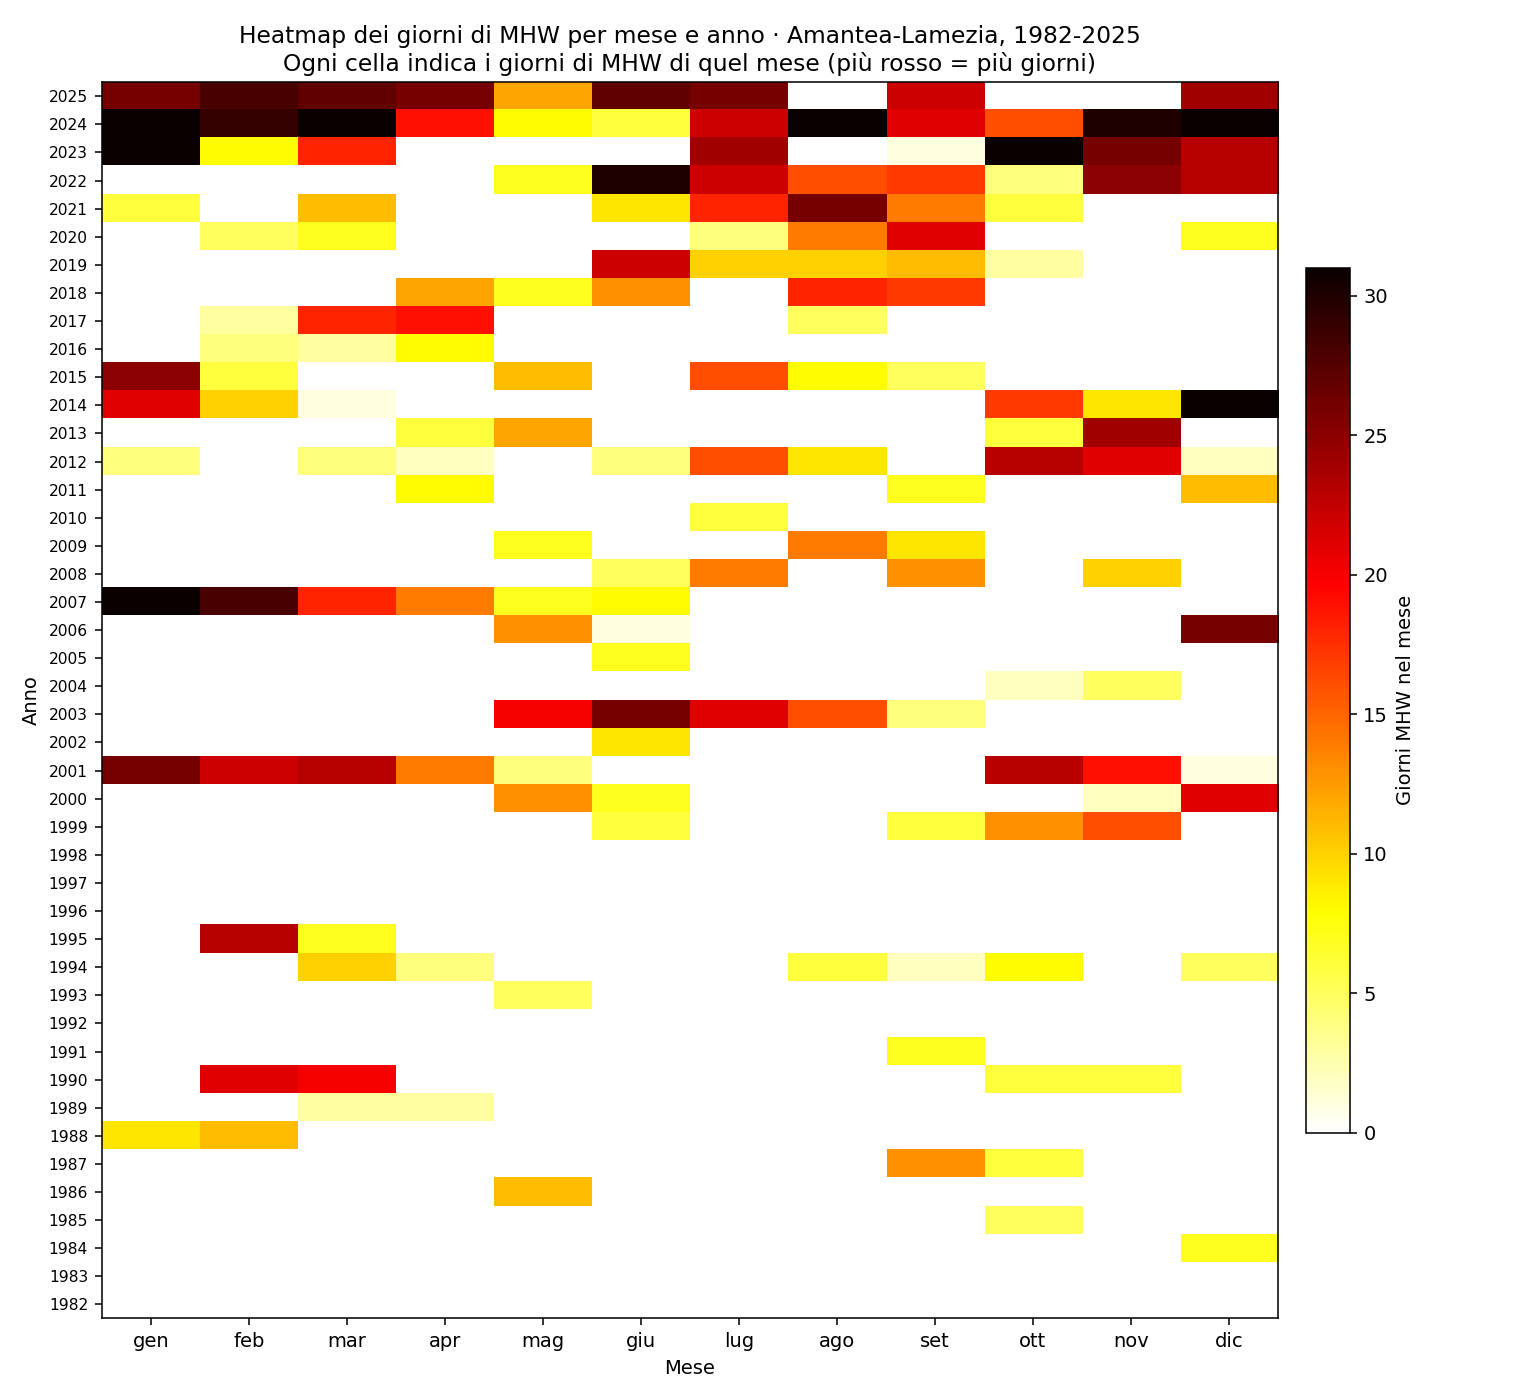
Figure 9 — Heatmap of MHW days per month and year, 1982-2025, on the Amantea-Lamezia stretch. y-axis: year (2025 at the top, 1982 at the bottom). x-axis: months from January to December. Cell colour: number of MHW days in that month (white = 0, black = 31, continuous scale). The white cells of the 1982-1996 period indicate months without any MHW episode; the black cells of 2023-2024-2025 indicate months almost entirely in an MHW state.
How to read the heatmap
The heatmap reveals four phenomena that the tables and annual charts cannot show with the same immediacy:
- Vertical expansion of the phenomenon: in the first 14 years (1982-1995) the chart is almost entirely white, a sign that MHW were sporadic and short. From 1998 onwards the number of coloured cells grows conspicuously. From 2017 onwards, all the rows have dark cells in several months.
- Seasonal widening: in the past decades the rare MHW were concentrated in June-September. Today the MHW cover practically all the months of the year: December 2023, January-February 2024 and 2025 have very dark cells, indicating almost continuous winter MHW.
- Special historical years: 2003 (the European heatwave) is clearly visible as a red band concentrated in May-August. 2001 stands out for the MHW at the start of the year. 2007 for January-February.
- The 'wall' of the recent years: 2022, 2023, 2024, 2025 show horizontal rows of almost solid colour - a qualitatively new situation in the historical series.
How much the climatology has shifted in 25 years
Another way of representing the change is to compare the 'typical curve' of a year computed over two different periods. Figure 10 overlays:
- In blue: the 1991-2020 climatology (the WMO 'normal') with its ±1 standard-deviation variability
- In red: the climatology of the decade 2016-2025 with its variability
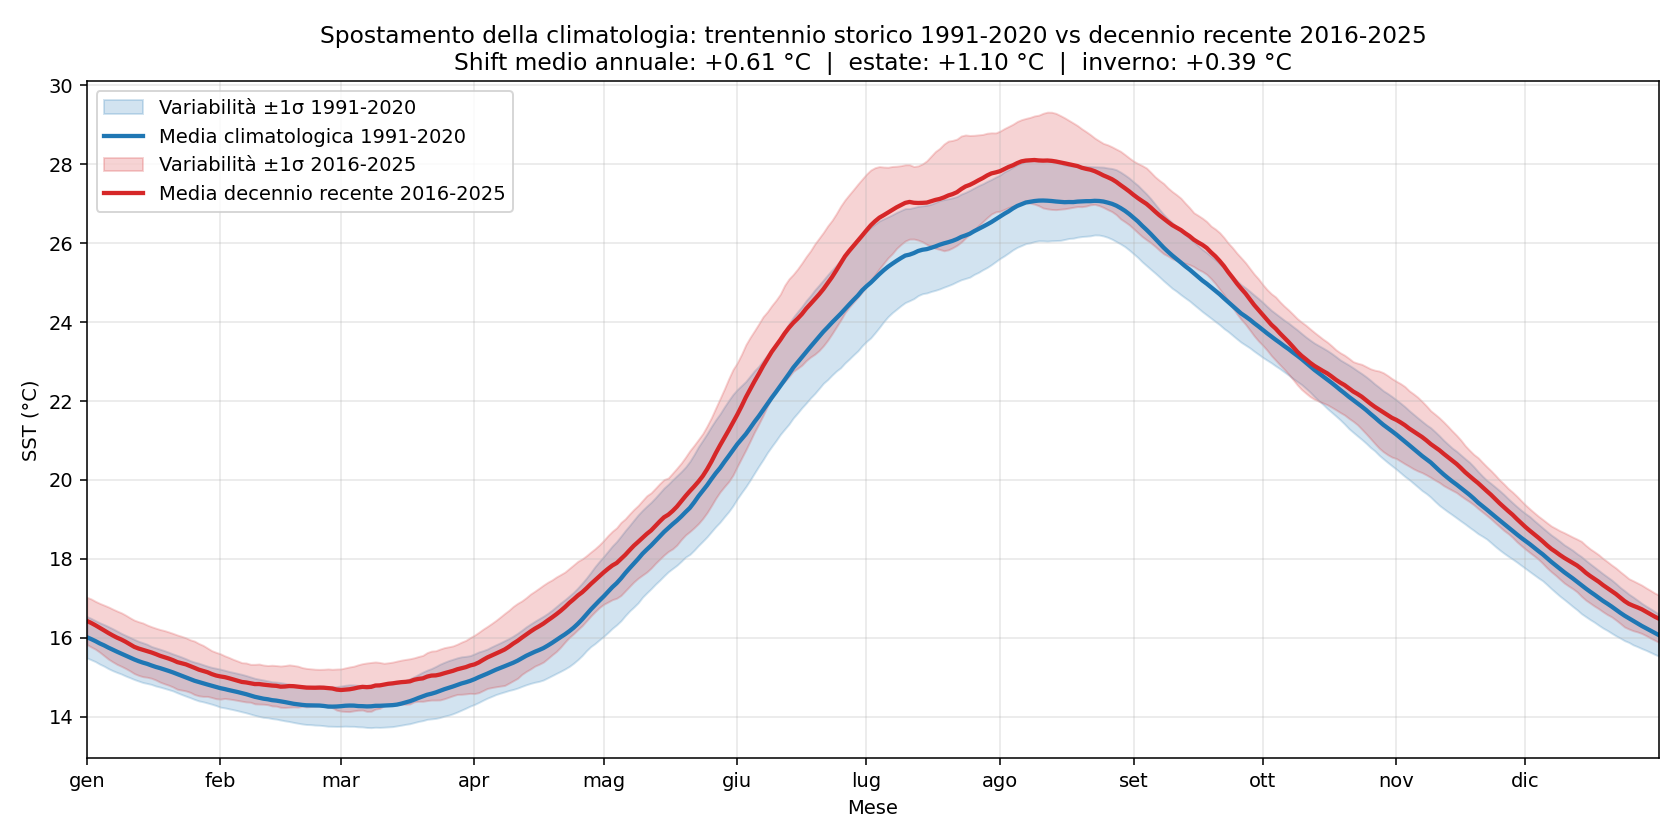
Figure 10 — Shift of the annual climatology between the historical 30-year period 1991-2020 (blue) and the recent decade 2016-2025 (red). The light band around each line represents the typical variability (±1 daily standard deviation). The chart title reports the mean annual shift (+0.61 °C), the summer shift (+1.10 °C) and the winter shift (+0.39 °C).
The difference between the two curves quantifies the mean warming: +0.61 °C in 25 years on the annual mean, but +1.10 °C in summer (with peaks of +1.5 °C in late July - early August). Winter has warmed less (+0.39 °C) but significantly, especially in February-March. An important detail should be stressed: the red ±1σ band of the recent decade lies largely ABOVE the blue band of the historical 30-year period. This means that the 'normal' years of 2016-2025 are already warmer than the 'extreme' years of 1991-2020 - it is no longer a comparison between exceptions but between different normals.
Historical accumulation of MHW days
Figure 11 shows the cumulative curve of MHW days from 1982 onwards. It is a very compact representation of the rate of accumulation: a linear curve would mean a constant rate, whereas a curve that bends upwards indicates acceleration.
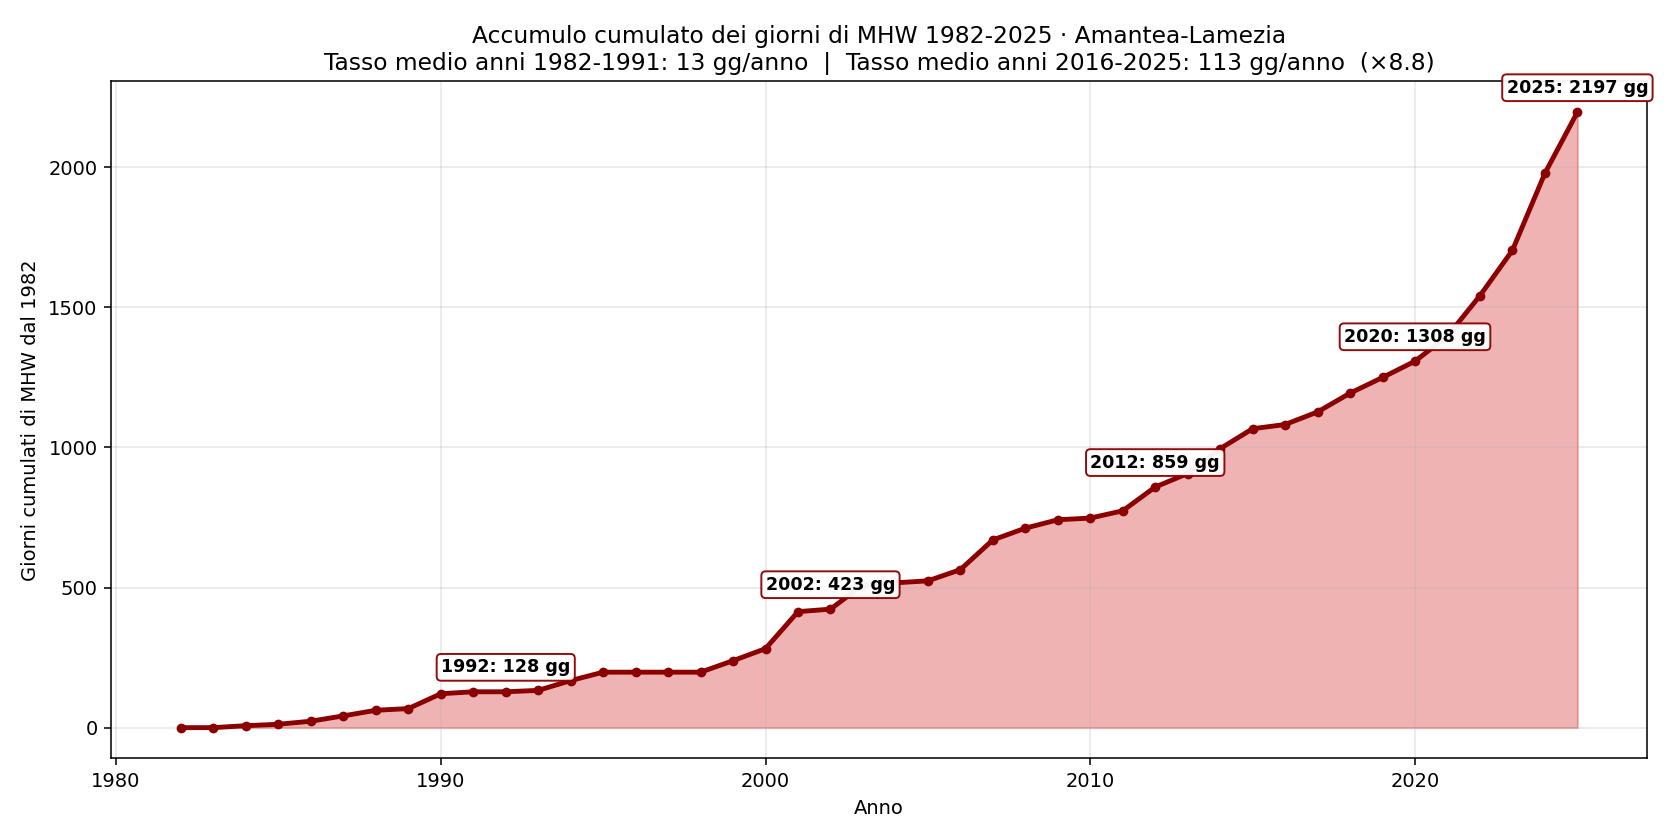
Figure 11 — Cumulative MHW days from 1982 to 2025. The y-axis shows the progressive total of MHW days accumulated since the start of the series. The markers indicate the totals at the end of 1992, 2002, 2012, 2020 and 2025. The chart title reports the mean annual rate of the first 10 years of the series (13 days/year) and of the last 10 years (113 days/year), with the growth ratio.
The figures are eloquent:
- Mean rate 1982-1991: 13 MHW days per year (a 'physiological' situation)
- Mean rate 2016-2025: 113 MHW days per year (an abrupt acceleration)
- An increase by a factor of 8.8: today's MHW are almost 9 times more frequent than those of the early years of the series
The inflection of the curve is particularly marked after 2020: in just 5 years (2020-2025) about 890 MHW days were accumulated, against 1,300 days accumulated in the 38 preceding years. It is the numerical signal that the phenomenon is not only increasing but is accelerating further.
How to read the chart
The upper panel is the most striking figure of the whole report. In the 1980s, the days on which the sea was in an MHW state were 5-20 per year: short and infrequent episodes. In the last five years the value has exploded:
| Year | MHW days | No. of events | Max anom. (°C) | Max category |
|---|---|---|---|---|
| 2021 | 90 | 4 | +3.09 | II - Strong |
| 2022 | 144 | 8 | +4.04 | III - Severe |
| 2023 | 162 | 5 | +4.24 | II - Strong |
| 2024 | 275 | 5 | +3.55 | III - Severe |
| 2025 | 218 | 6 | +4.15 | II - Strong |
The 2024 figure (275 MHW days out of 366) means that the sea spent 75% of the year in a heatwave state. To give a reference scale: no year of the series before 2020 exceeded 132 days; many years are below 30 days.
The computed linear trend is +31 MHW days per decade. Over 44 years this means a total increase of about 135 days - that is, in the past almost the whole year was 'thermally normal', whereas today a growing portion of the year is in a state of persistent anomaly.
Top longest events of the series
A new characteristic of the recent years is the formation of winter and trans-seasonal MHW, never observed before in the series. The longest events of the historical series are:
| # | Period | Duration | Max anom. | Cat. | Notes |
|---|---|---|---|---|---|
| 1 | 23 Dec 2023 → 19 Apr 2024 | 119 days | +2.98 °C | II - Strong | Winter-spring MHW (never observed before) |
| 2 | 6 Dec 2006 → 18 Mar 2007 | 103 days | +1.65 °C | II - Strong | Generalised mild winter |
| 3 | 16 Oct 2024 → 14 Jan 2025 | 91 days | +1.90 °C | II - Strong | The pattern of a sea 'that does not cool down' continues |
| 4 | 10 Jul → 16 Sep 2024 | 69 days | +3.55 °C | III - Severe | The 2024 summer MHW: the most severe in peak intensity |
| 5 | 9 Dec 2022 → 8 Feb 2023 | 62 days | +2.00 °C | III - Severe | Anomalous winter 2022/23 |
| 6 | 20 Jan → 21 Mar 2025 | 61 days | +1.87 °C | II - Strong | Confirmation of the recent winter pattern |
| 7 | 30 Sep → 26 Nov 2023 | 58 days | +2.39 °C | II - Strong | Warm autumn 2023 |
| 8 | 4 Jun → 26 Jul 2025 | 53 days | +4.15 °C | II - Strong | Peak of the seasonal anomaly of 2025 |
The most relevant novelty is that the longest events of the series are not the summer ones (as one might instinctively think) but the winter ones. A winter sea and atmosphere 'too warm relative to the winter normal' for consecutive months. This pattern, unknown until 2006, is today almost annual since 2022.
Implications of the winter and trans-seasonal MHW:
- A lack of thermal rest for the water column: the summer stratification does not break down completely, and in spring it restarts from a warmer baseline.
- An altered reproductive cycle for fish species (sardines, anchovies): the trigger temperature of spawning is reached at anomalous times.
- Possible winter survival of thermophilic alien species that in the past did not withstand the Mediterranean winter.
- Prolonged stress on benthic organisms: instead of an acute summer episode followed by recovery, an almost-continuous stress takes shape.
Thermal-stress thresholds for the typical species
To give biological meaning to the observed MHW, we report the thermal tolerance thresholds documented in the literature for the sensitive species of the Calabrian Tyrrhenian coast:
| Species | Stress | Mortality | Effect |
|---|---|---|---|
| Posidonia oceanica | 26 °C | 28 °C | Prolonged stress → rhizome necrosis → meadow regression |
| Paramuricea clavata (red gorgonian) | 23-24 °C | 25 °C for >2 weeks | Mass mortality, episodes in 1999, 2003, 2022 |
| Eunicella spp. (yellow gorgonians) | 24-25 °C | 26 °C | Tissue necrosis, loss of skeleton |
| Spongia officinalis (sponges) | 25 °C | 26 °C prolonged | Widespread summer mortality |
Comparing with our figures: a summer MHW of Category III such as that of July-September 2024 (maximum anomaly +3.55 °C) developed on a summer baseline already at 26-27 °C - this means that during the event the warmest pixels of the box touched and exceeded 30 °C daily, well within the mortality range for gorgonians and posidonia.
3.2 Posidonia oceanica and underwater meadows
Posidonia oceanica is a marine plant endemic to the Mediterranean (not an alga: it is a seagrass, similar to land plants, with roots, rhizomes and leaves). Its underwater meadows are protected at the European level for their key ecological role: they oxygenate the water, stabilise the seabed, host fish nurseries and sequester carbon.
Prolonged summer thermal stress compromises the photosynthesis and growth of this species. The symptoms of heat-related decline include: a reduction in the density of the leaf shoots, anomalous flowering (posidonia flowers under acute stress), rhizome necrosis, and a regression of the lower limit of the meadow at depth.
The Amantea-Lamezia stretch hosts historical posidonia meadows, especially off Falerna Marina, Nocera Terinese, Gizzeria Lido and Lamezia Marinella. The regression of the meadows of the Gulf of Sant'Eufemia has been under observation for about 15 years. It is plausible - in the light of our data - that the combination of thermal stress (summer SST 2 °C above the norm) and local human pressures (anchoring, discharges, eutrophication) is accelerating this decline.
3.3 Gorgonians, corals and benthic fauna
Gorgonians are branching cnidarians that colonise submerged rock walls. Species typical of the Calabrian Tyrrhenian coast: Paramuricea clavata (red gorgonian, depth 20-50 m), Eunicella cavolini (yellow), Eunicella singularis (white). They are ecological indicators sensitive to thermal stress.
Mass mortality events documented in the western Mediterranean:
| Year | Area | Notes |
|---|---|---|
| 1999 | Liguria-Provence | The first large documented event, ~60% mortality below 25 m |
| 2003 | NW Mediterranean | Concurrent with the European atmospheric heatwave |
| 2018-2019 | Southern Tyrrhenian, Sicily | Documented on Calabrian stretches too |
| 2022 | The whole NW Mediterranean | Considered the most serious of the last 25 years |
| 2024 | The whole Mediterranean | Record anomalies, assessments ongoing (T-MEDNet network) |
The gorgonian walls of Capo Suvero, Capo Vaticano and Tropea represent, for many species, the southern limit of distribution. Under the current thermal regime, the depth of the 'thermal refuge' (below the thermocline) is shifting downwards: populations that 30 years ago lived stably at 25 m are today stressed in summer, and must move to 40-50 m to find compatible temperatures.
3.4 Harmful algal blooms (HAB)
HAB (Harmful Algal Blooms) are explosive proliferations of phytoplankton species that produce harmful effects. The main ones relevant to the Calabrian Tyrrhenian coast:
Ostreopsis ovata
A benthic dinoflagellate microalga that produces palytoxin (PLTX) and ovatoxins. It is the most relevant HAB for the Italian Tyrrhenian, under systematic surveillance by ARPA Calabria.
- Optimal conditions: SST 25-28 °C, a calm sea, rocky or pebbly seabeds
- Effect on humans: a respiratory-irritative syndrome (eyes, nose, throat, airways) transmitted by marine aerosol; no intoxication from direct contact or from the ingestion of fish
- Historical case: the Genoa bloom of 2005, over 200 people with acute symptoms, emergency-room admissions
- Trend: the number and intensity of the events have clearly increased since 2005, with a robust correlation with high summer SST
Pseudo-nitzschia, Alexandrium, other HAB
Diatoms that produce domoic acid (ASP - Amnesic Shellfish Poisoning) and dinoflagellates that produce saxitoxins (PSP - Paralytic Shellfish Poisoning). Sporadic episodes in the southern Tyrrhenian, with possible temporary bans on the harvesting of bivalve molluscs.
3.5 Mucilage
The mucilage phenomenon has a dedicated section (Part 2 of the document) on account of its particular tourism relevance.
3.6 Tropicalisation of the Mediterranean
With summer SST now at levels typical of North African seas, the establishment of thermophilic species (originating from warmer seas) is now a reality. Species already observed or expected in the Calabrian Tyrrhenian:
| Species | Type | Origin | Status in Calabria |
|---|---|---|---|
| Caulerpa cylindracea | green alga | Australia | Established and expanding |
| Siganus luridus / S. rivulatus | rabbitfish | Red Sea (Lessepsian) | Sporadic sightings |
| Fistularia commersonii | bluespotted cornetfish | Indo-Pacific | Documented along the whole coast |
| Pterois miles | devil firefish (lionfish) | Red Sea | Active expansion from Sicily |
| Rhopilema nomadica | jellyfish | Indo-Pacific | Sightings increasing |
| Saurida lessepsianus | lizardfish | Red Sea | Expected in the short term |
3.7 Fishing and commercial fish fauna
The thermal changes also have direct effects on species of commercial importance for Calabrian fishing (Pizzo, Vibo, Cetraro, Diamante):
- Sardines, anchovies, mackerel (small pelagics): the thermal window favourable to reproduction is compressed, with possible structural declines (already documented in the Adriatic).
- Prized oily fish (bonito, mahi-mahi): a shift of the shoals towards the north or towards greater depths.
- Cephalopods (octopus, squid): less thermally sensitive, with a possible relative advantage in the new condition.
- Bluefin tuna: paradoxically, the warmer waters extend the favourable thermal window - one of the few 'winners' of the transition.
4. Mucilage preconditions on the Amantea-Lamezia stretch
This chapter goes into detail on the phenomenon with the greatest practical relevance for the tourism sector and for the public perception of sea quality: summer mucilage. The chapter combines a description of the phenomenon with a quantitative analysis of its thermal precursors in the 1982-2025 data.
4.1 What mucilage is and why it is a nuisance
Contrary to what the term 'algal blooms', often used by the press, suggests, mucilage is not an alga. It is a gelatinous mass of a polysaccharide nature - a kind of 'transparent or slightly amber biological glue' - produced by phytoplankton under stress (heat, a calm sea, a scarcity of nutrients relative to the biomass). From a chemical point of view it is an aggregate of extracellular polysaccharides (EPS) that organise themselves into transparent gelatinous particles (TEP, Transparent Exopolymer Particles) which in turn aggregate into macroscopic formations.
The species involved in the southern Tyrrhenian include:
- Chrysophaeum taylorii - a golden alga, frequent on the Calabrian and Sicilian Tyrrhenian coast
- Aphanocapsa marina - a cyanobacterium of the warm Mediterranean seas
- Gonyaulax fragilis - a dinoflagellate, more typical of the Adriatic
Tourism impact: the visible sequence
The critical aspect for operators is that the phenomenon has several stages of visibility, each with a different effect on the tourist's perception. Even early stages, not serious in ecological terms, can produce reputational damage via social media:
| Stage | Appearance | Effect |
|---|---|---|
| Pelagic filaments | Whitish/yellowish strings, 10-50 cm, suspended in water | Visible while diving, perceived as 'suspended dirt' by bathers |
| Floating aggregates | Floating yellow-brown gelatinous patches, up to 50 cm | Photographable, the first element that 'makes the news' on social media |
| Surface foam | Persistent, brown foam along the shoreline | The worst appearance for the tourist; beaches perceived as dirty |
| Deposit on the shoreline | A brown gelatinous blanket, decaying and foul-smelling | Beach clubs must clean repeatedly, a prolonged drop in attendance |
| Underwater 'carpet' | A brown veil adhering to the bottom, on posidonia or rocks | Smothering of posidonia and gorgonians, a reduction in catch |
A critical point for communication: the reputational damage is out of phase with the real phenomenon. A viral photograph in July can compromise the bookings of the whole summer, even after the sea has cleared. For this reason it is important to anticipate any possible event narratively.
4.2 Why they form: the biological mechanics
The mechanism is well understood at the scientific level. Under normal conditions (a sea well mixed by the wind, a turbulent spring), phytoplankton is balanced: nutrients from the bottom flow up to the surface, the biomass is controlled by turbulence, and the exopolymers produced are dispersed.
When the sea stratifies thermally (typical of summer), everything changes:
- The surface layer (the first 10-30 m) 'isolates' itself from the rest: the warm water floats above the cold deep water and the two layers no longer mix.
- The surface layer becomes poor in nutrients (oligotrophic): the nitrogen and phosphorus that arrived with the spring river floods have already been consumed, and the deep ones do not rise.
- The phytoplankton cells enter a state of stress: they have abundant light but scarce food, a condition of metabolic imbalance.
- Under stress, instead of growing and dividing, the cells release extracellular polysaccharides (EPS) as a defence mechanism.
- In calm water (weak wind, an oily sea), these polymers do not disperse but aggregate into TEP, then into flocs, then into macroscopic masses - the mucilage.
- A few days of weak wind are enough to accumulate the mucilage at the surface or along the shoreline.
4.3 The four triggering factors
The formation of mucilage requires the temporal coincidence of four conditions. SST is the first and the easiest to monitor, but on its own it is not enough:
| Factor | What is needed | What we can measure |
|---|---|---|
| Thermal | SST > 22 °C early, stable stratification for several weeks | ✓ Measurable via satellite (this analysis) |
| Mechanical | A calm sea for >10-15 consecutive days, weak wind | Requires wind and wave data (buoys, ECMWF models) |
| Nutritive | An input of nitrogen and phosphorus in the preceding months (rain, discharges, rivers) | Requires specific ARPA data and discharge monitoring |
| Biological | A predisposed phytoplankton community, the absence of predators | Requires direct sampling and microscopy |
Operational conclusion: SST counts as a 'permit to happen'. If the thermal indicator is high but the other three factors do not align, the event may not occur. But if the SST is low, the event is mechanically impossible.
4.4 The analysis: 44 years of thermal precursors (Amantea-Lamezia)
On the basis of the daily SST data 1982-2025 for the Amantea-Lamezia stretch, four indicators specific to the mucilage precursor preconditions were computed:
| Indicator | Meaning |
|---|---|
| Mean May SST | The anticipation of stratification: if May is already warm, the summer starts with the thermocline already formed. |
| Day of year (doy) of the first exceedance of 22 °C | When the window of favourable conditions 'opens': the earlier, the longer the vulnerable season. |
| Days in the critical 24-28 °C window | The duration of the thermal window in which mucilage typically proliferates. |
| Days with SST ≥ 25 °C | A general indicator of marked summer stratification. |
All the indicators were combined into a composite precondition index (scale 0-100), weighted to give more importance to the earliness of stratification (30%) and to the duration of the critical window (30%), and less to the May SST (25%) and to the days above 25 °C (15%).
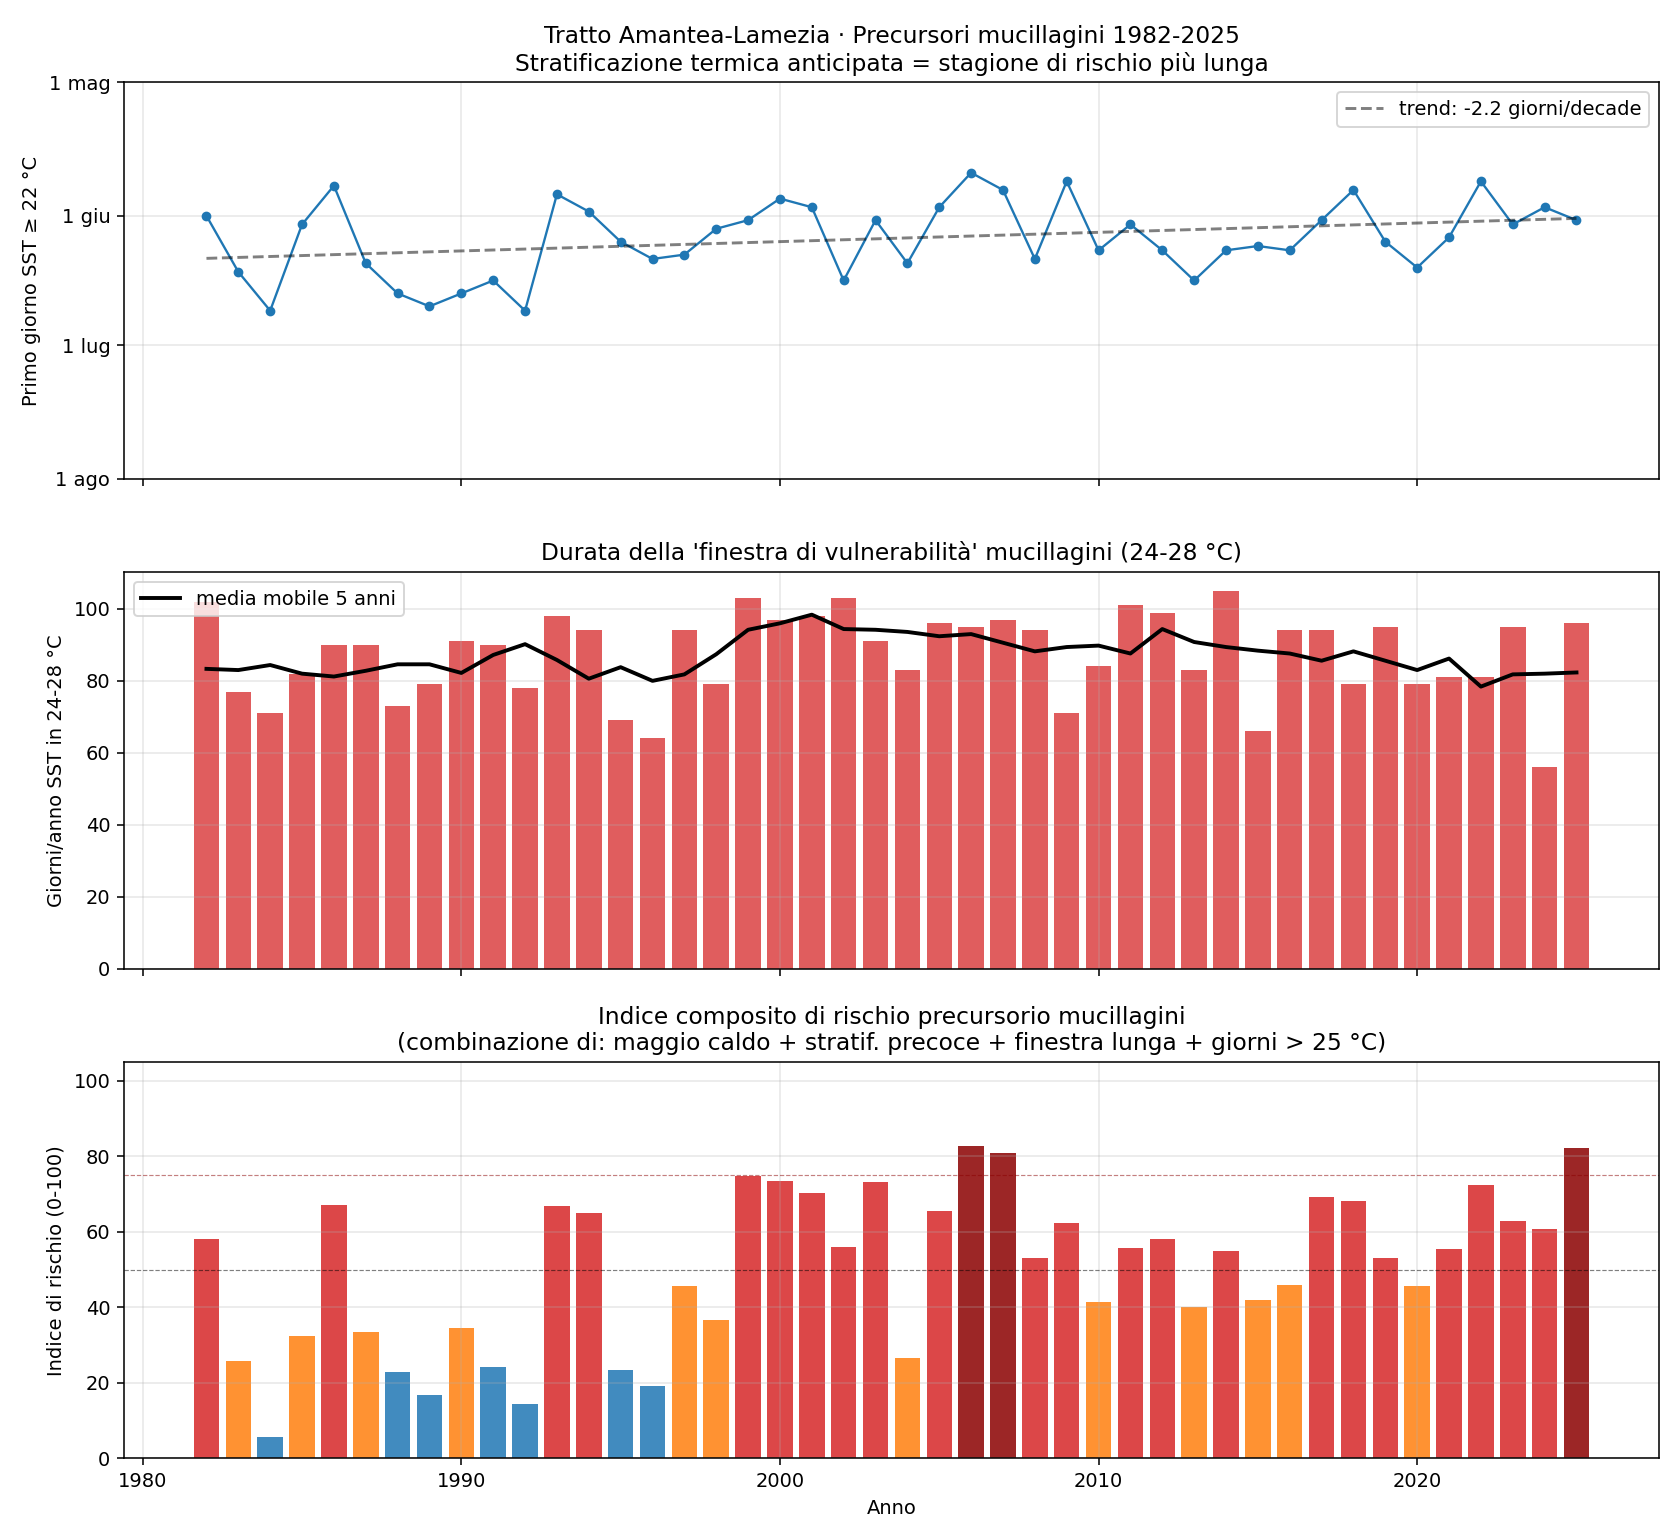
Figure 12 — Mucilage-precursor indicators on the Amantea-Lamezia stretch, 1982-2025. Upper panel: day of the year of the first exceedance of 22 °C (inverted axis: higher = earlier = worse). Central panel: number of days/year in the 24-28 °C thermal window (with a 5-year moving average in black). Lower panel: composite precondition index (0-100), bars coloured by level band (blue low, orange medium, red high, dark red very high).
How to read the chart
The upper panel shows a clear tendency: the day on which the SST reaches 22 °C - the typical threshold for the onset of stratification - has moved earlier by 2.2 days every decade. In the 1980s this happened on average towards the end of June; today it typically happens in the first week of June. That is 10-15 days less of cool 'pre-season', that is, that many more days of season with conditions favourable to the phenomenon.
The central panel shows that the number of days in the critical 24-28 °C window has grown: the moving average (black line) has gone from about 80 days/year in the 1980s to over 90 days/year in the last decade, with annual peaks up to 100-103 days.
The lower panel - the composite index - visually identifies the years most exposed from the thermal point of view. The dark-red bars (index ≥75) are few years: 2006, 2007, 2025. The red bars (50-75) are many, especially after 2015. The blue bars (a low index) have practically disappeared after 2015.
Top 5 years by precursor preconditions
Combining the four indicators in the composite index, the years with thermal conditions most favourable to mucilage formation on the Amantea-Lamezia stretch turn out to be:
| Pos. | Year | May anom. | 1st day ≥22°C | Days 24-28°C | Days ≥25°C | Index |
|---|---|---|---|---|---|---|
| 1 | 2006 | +1.15 °C | 22 May | 95 | 74 | 82.8 |
| 2 | 2025 | +1.35 °C (record) | 2 June | 96 | 111 (record) | 82.3 |
| 3 | 2007 | +0.94 °C | 26 May | 97 | 76 | 80.9 |
| 4 | 1999 | +0.44 °C | 2 June | 103 | 78 | 74.8 |
| 5 | 2000 | +1.01 °C | 28 May | 97 | 56 | 73.5 |
| — | 2022 | +0.68 °C | 24 May | 81 | 105 | 72.4 |
| — | 2018 | +1.07 °C | 26 May | 79 | 85 | 68.1 |
It should be stressed that 2022 - a notoriously difficult year for the Mediterranean - drops out of the top 5 of the precursor index because the SST exploded beyond 28 °C, leaving the 'optimal' mucilage window (24-28 °C). In that case mucilage events in the Calabrian Tyrrhenian still occurred, a sign that at a certain point the SST becomes so high that it goes beyond the mucilage window, while in the meantime massive thermal stresses take place.
4.5 Recent annual cycles vs the climatology
Figure 13 visually compares the daily course of the SST over the last 5 years (coloured lines) with the mean course of the 30-year period 1991-2020 (thick black line) and with its typical variability band (grey zone, ±1 standard deviation). The horizontal dashed lines indicate the operational thresholds of interest: 22 °C (the onset of thermal stratification) and 24 °C (the start of the window potentially favourable to mucilage).
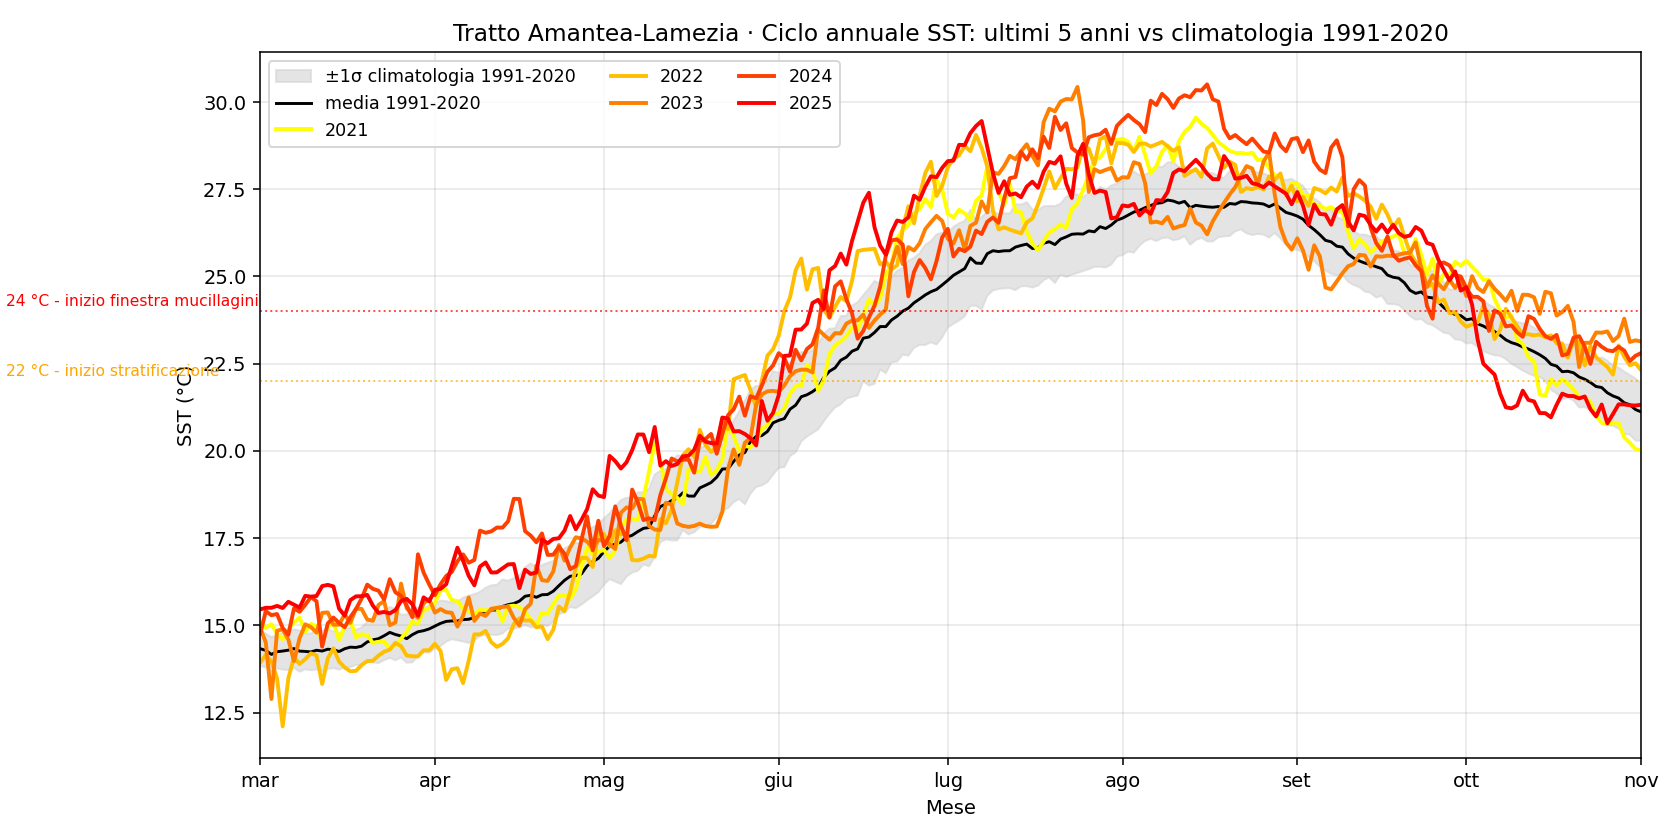
Figure 13 — Daily course of the SST on the Amantea-Lamezia stretch. Black line: the 1991-2020 mean. Grey band: ±1 standard deviation relative to that mean. Coloured lines: each of the last 5 years (2021-2025). The two dotted horizontal lines mark the thresholds of 22 °C (the onset of stratification) and 24 °C (the start of the window of favourable conditions).
How to read the chart
The curves of the last 5 years sit systematically above the entire historical variability band from June to September. This means that these are not summers 'above average' in the ordinary sense of the term - they are summers off the scale relative to what was recorded in the three preceding decades. Three concrete operational observations:
- May: the 2025 SST fluctuates around 20 °C, when the historical mean was 18 °C. By June the water is therefore already ready to stratify.
- July: all the last 5 years exceed 27 °C at the peak. The climatology was at 25.5 °C.
- October: the sea no longer cools down. The stratification dissolves later, the windows of favourable conditions extend until mid-October, when in the past they closed at the end of September.
4.6 Operational implications for the tourism sector
On the basis of the historical data and the computed indicators, it is possible to outline an indicative calendar of exposure to conditions favourable to mucilage for the operators of the Amantea-Lamezia stretch:
| Period | Operational guidance |
|---|---|
| May | SST monitoring: if the mean exceeds 19 °C, the summer starts stratified (a condition verified in 4 of the last 5 years) |
| First half of June | If the SST exceeds 22 °C by 5 June, the extended thermal window is practically certain |
| July-August | The peak of exposure. A critical period for the visual appearance of the coast; daily visual surveillance is recommended |
| September | Historically a period in which the preconditions decline, but in the last 5 years the sea stays above 24 °C until the end of the month - preconditions prolonged |
| October | Preconditions increasing relative to the past; it is worth considering this month too in the assessments |
Concrete actions recommended for beach clubs, hotels, coastal restaurants, charters:
- Preventive communication. Prepare, already at the start of the season, informational content (a web page, social-media posts) that explains to the public what mucilage is, that it is not pollution (a common misperception), and that it is not toxic on contact. Anticipating the correct narrative reduces the reputational impact of any viral photos.
- Early monitoring. Subscribe to the weekly ARPA Calabria bulletin for Ostreopsis and bathing-water quality. For more structured operators: daily photographic documentation of the shoreline (drone or webcam) as evidence of the 'reference state'.
- Active cleaning. Decaying mucilage deposited on the shoreline should be removed within 24-48 hours: as it decays it emits foul-smelling sulphur compounds and rapidly worsens the bathing experience.
- Diversification of activities. When there are peaks of mucilage on the shoreline, alternative activities (mountain excursions, inland parks, local food and wine) can preserve revenue while waiting for bathing conditions to return.
- Territorial coordination. For associated operators (tourism consortia, Chambers of Commerce), a joint observatory of sea quality allows a unified response instead of scattered individual initiatives.
5. Final summary and proposals
5.1 What we have learned from the data
- The sea in front of the Calabrian Tyrrhenian coast warmed by about 1.7 °C between 1982 and 2024 in terms of the annual mean, and by over 2 °C in terms of the summer mean.
- The warming is regional, not local: the Amantea-Lamezia stretch shows values practically identical to those of the whole coast from Praia a Mare to Scilla.
- The rate of warming is accelerating: the linear trend 1982-2025 is +0.52 °C/decade in summer, but computing only the last 30-year period the rate rises to about +0.7 °C/decade.
- The 'warm sea' season has lengthened by 3-4 weeks: today the sea warms 10-15 days earlier and cools 10-15 days later than in the 1980s.
- The five summers 2021-2025 all have an anomaly above +1 °C relative to the 1991-2020 mean. A situation never observed before.
- 2024 is the absolute record of the series: a mean annual SST of 21.33 °C, a summer anomaly of +2.00 °C in the Amantea-Lamezia focus.
5.2 The consequences in summary
On the ecological level:
- Thermal stress beyond the mortality threshold for gorgonians, posidonia and sponges in the last decade.
- An increasing frequency of marine heatwaves (MHW).
- The active establishment of thermophilic alien species.
On the health/bathing level:
- A thermal window favourable to Ostreopsis ovata that is extended and recurring.
- Precursor conditions for mucilage in a chronic regime since 2015.
On the economic level:
- The exposure of the coastal tourism sector to reputational events (visible mucilage) that are progressively more frequent.
- Pressure on the coastal fishing of small pelagics.
5.3 Operational proposals
5.3.1 Automatic monitoring system (a two-dataset architecture)
The real-time monitoring system is not based on the same dataset used for the historical analysis - that would be impossible, given the 4-5 month lag of the reprocessed product. The correct architecture combines the two Copernicus datasets (REP and NRT) as follows:
Phase 1 - Building the thresholds (one-off, already carried out):
- From the REP historical series 1982-2025, the daily climatology (the expected mean SST for each day of the year) is computed over the reference 30-year period 1991-2020.
- The 90th-percentile threshold for each day of the year is also computed: this is the threshold beyond which one is in an MHW state.
- Analogous indicators for the mucilage preconditions are computed (expected May SST, critical thermal windows).
- These 366 + 366 + N thresholds are saved locally as a reference table.
Phase 2 - Daily monitoring (operational):
- Every morning at 04:00 an automatic query to the NRT dataset (SST_MED_SST_L4_NRT_OBSERVATIONS_010_004) downloads the SST of the day just ended for the Amantea-Lamezia box. Data volume: ~50 KB.
- The SST is compared with the expected climatology and with the 90th-percentile threshold for that day of the year. The anomaly, any ongoing MHW state, and a progressive mucilage-precondition indicator for the season are computed.
- The values are published as Home Assistant entities (sensor.sst_amantea_lamezia, sensor.anomalia_sst, sensor.indice_mucillagini) and archived historically.
- If predefined thresholds are exceeded (see below), an automatic Telegram notification is sent.
Phase 3 - Updating the historical archive (every six months, optional):
- Roughly every 6 months Copernicus publishes a new block of REP that extends the historical series.
- A six-monthly job refreshes the long-term charts and recomputes the linear trends.
Proposed alert thresholds:
| Trigger | Condition | Notification |
|---|---|---|
| Opening of the mucilage window | First daily SST ≥ 22 °C of the year | Notice: 'the stratification window starts today - watch for mucilage' |
| Entry into the critical window | First daily SST ≥ 24 °C | Notice: 'thermal window favourable to mucilage - active vigilance' |
| MHW ongoing | 5th consecutive day above the 90th percentile | Notice: 'a marine heatwave is under way' |
| Severe MHW (cat. III) | Anomaly > 3× the threshold-climate deviation | Alert: stress for gorgonians and posidonia, high HAB risk |
| Prolonged mucilage window | 10th consecutive day in the 24-28 °C range | Notice: 'precursor conditions consolidated, a possible event soon' |
| High monthly index | Monthly index > the 75th historical percentile | Weekly summary via Telegram |
The NRT has slightly less robust statistical characteristics than the REP: the values may be reassigned by a few tenths of a degree when the definitive REP is published. For alert purposes this is entirely irrelevant (an anomaly of +3 °C does not become +2.5 after the reprocessing); for historical-archive purposes it is handled with the six-monthly job of Phase 3.
5.3.2 Territorial coordination
- A convergence of Copernicus data (SST), ARPA Calabria monitoring (Ostreopsis, bathing-water quality), and operator reports (direct observation of the shoreline) into a single weekly bulletin.
- A common, accessible language to be disseminated to operators and tourists, avoiding both sensationalism and underestimation.
5.3.3 Extension of the analysis
The data collected allow further analyses that could be requested or self-produced:
- A formal count of the MHW per year according to the definition of Hobday et al.
- An anomaly map of a single specific summer (e.g. August 2024).
- A spatial extension of the study (e.g. the whole southern Tyrrhenian, up to the Cilento or to Sicily).
- A comparison with other local historical series (the tide-gauge buoy, ENEA sensors).
5.4 Methodological limitations and honesty of the data
It is only right to list what this analysis can and cannot say:
- What it can say: it describes accurately and in a statistically robust way the evolution of the sea surface temperature and its changes over time. The source (CMEMS L4 reprocessed) has a decadal track record and a stated accuracy of 0.2-0.3 °C. The temporal signal (1.7 °C in 44 years) is amply greater than the instrumental noise.
- What it cannot say: it does not measure the temperature below the surface. SST is the 'skin' of the sea; marine heatwaves in the water column can be even more persistent and damaging to benthic species.
- What it cannot predict on its own: the specific occurrence of mucilage events or of Ostreopsis blooms. SST is a necessary but not sufficient condition; data on wind, nutrients and the composition of the phytoplankton are needed.
- What is inference: the specific impacts on individual posidonia meadows or gorgonian populations of the Amantea-Lamezia stretch are inferred from the general Mediterranean literature and from the thermal tolerance thresholds of the species. A local verification would require underwater transects and sampling.
With these caveats, the picture that emerges from the data is in any case robust enough to support operational decisions: the warming is real, it is accelerating, and it has concrete and already observable implications - it is not a future projection.
— End of the report —