Preamble
The previous five strands of this work looked at sea temperature, the physical comparison of coasts, the microbiological quality of bathing waters, the biogeochemistry of the basin and the cross-domain confirmation from citizens' social-media reports. One last dimension is missing, perhaps the most concrete for those who live on the coast: the sea level and its erosion tendency on the Calabrian beaches. It is a physical phenomenon measured in millimetres per year that, decade after decade, rewrites the coastline.
The study answers three concrete questions:
- How many millimetres per year is the sea rising in front of the Calabrian coast?
- Are extreme events (storm surges, high-tide peaks) becoming more frequent?
- Which stretches of coast are most vulnerable to erosion, and why?
1. Method
Three complementary public sources, all integrated inside the Copernicus Marine Service ecosystem:
| Source | Variable | Period | Resolution | Use |
|---|---|---|---|---|
| Multi-mission L4 satellite SLA (DUACS) | Sea Level Anomaly (cm) | 1993-2024 | ~7 km, daily | SLR trend + extreme events |
| OMI Extreme Sea Level Mediterranean | SL P99 and P1 (cm) | 2000-2023 | 41 in-situ tide gauges | Gold-standard validation |
| Med Physics Reanalysis | zos (Sea Surface Height) | 1987-today | 4 km, daily | Model reference |
Satellite SLA is the primary source: 32 years of gridded altimetry, the same dataset used in the Mediterranean SLR literature (Bonaduce et al. 2016: +2.8 mm/yr). For the five TYRN SEA zones, the daily areal mean is computed and from it the linear trend, confidence intervals and the percentiles of extremes. The data is then validated against the RMN tide-gauge stations of the Italian Ministry of Defence located directly on the Calabrian coasts: RMN-ReggioCalabria on the Strait, RMN-Crotone on the North Ionian. A previous version of the work tried the analysis with the reanalysis model (variable zos): the result was only 0.2-0.9 mm/yr, well below the literature. The cause is that the reanalysis model has internal corrections (data-assimilation drift, Inverse Barometer) that dampen the long-term signal. Pure satellite data, instead, returns the expected numbers.
2. Sea-level trend 1993-2024
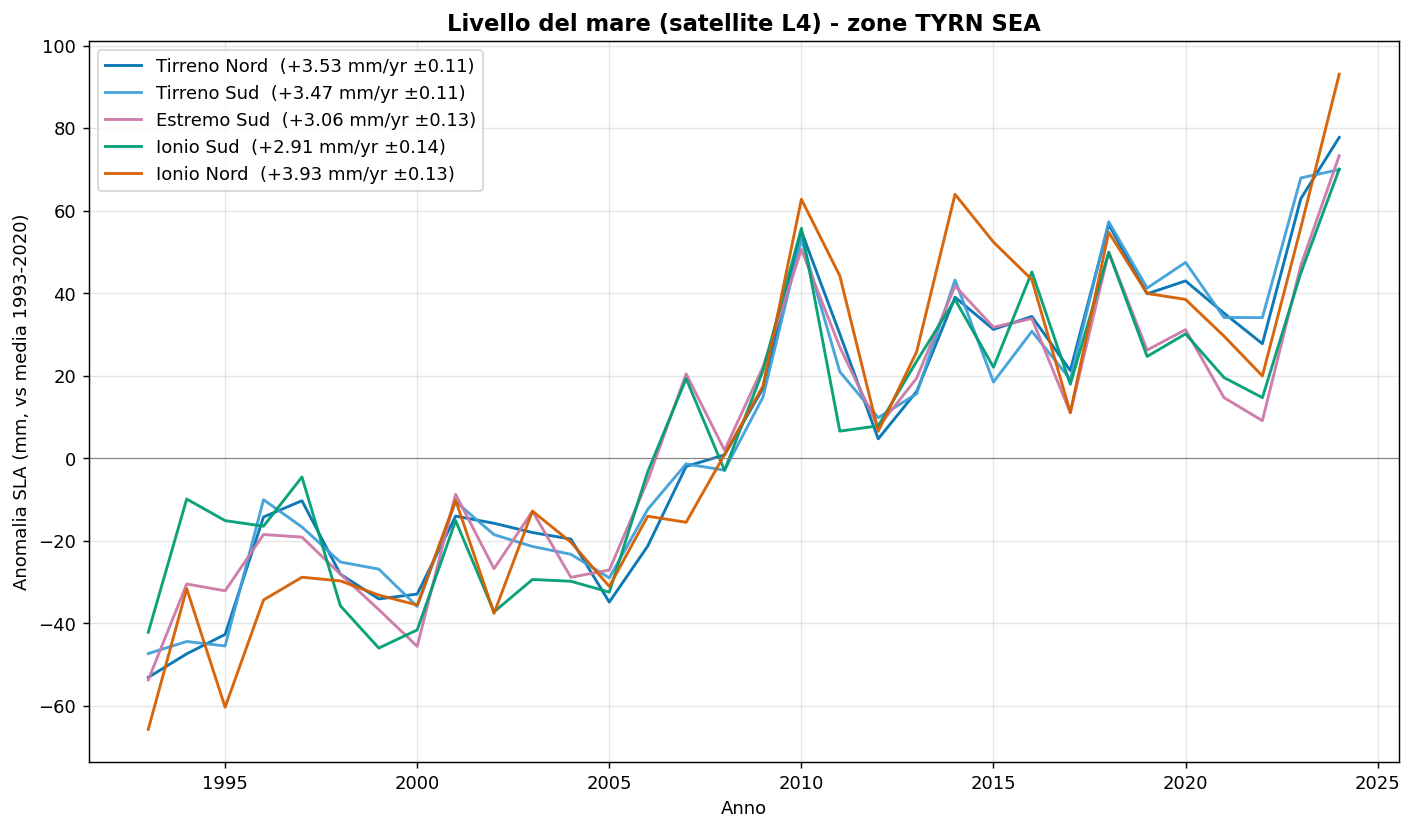
Table of linear trend coefficients (mm/yr) obtained from satellite SLA for each TYRN SEA zone, with 95% confidence intervals from the residuals:
| Zone | SLR trend (mm/yr) | 95% CI | Max anomaly (mm) | Peak year |
|---|---|---|---|---|
| Tirreno Nord | +3.53 | ±0.11 | +77.7 | 2024 |
| Tirreno Sud | +3.47 | ±0.11 | +69.9 | 2024 |
| Estremo Sud | +3.06 | ±0.13 | +73.3 | 2024 |
| Ionio Sud | +2.91 | ±0.14 | +70.1 | 2024 |
| Ionio Nord | +3.93 | ±0.13 | +93.1 | 2024 |
All trends are statistically significant: the 95% confidence intervals are very tight (±0.11-0.14) and do not touch zero. The regional mean is +3.4 mm/yr, consistent with the literature value Bonaduce et al. 2016 (+2.8 mm/yr Med mean 1993-2018); the slight excess is explained by the more recent period that includes the 2019-2024 years of strong global SLR acceleration.
Two notable observations:
- All five zones have peak year 2024. Last summer was the warmest of the SST series (Part 1 of this work) and at the same time the year of maximum sea level. Thermal expansion of the sea (warmer water = more voluminous water) and contributions from glacial melt sum up. Ionio Nord reaches +93 mm above the 1993-2020 norm in 2024.
- Ionio Nord has the highest trend (+3.93 mm/yr), Ionio Sud the lowest (+2.91). The difference between the Calabrian coasts is about 1 mm/yr — contained but real. Over a 30-year horizon, that is 30 mm of cumulative difference: for low sandy beaches, the sign shows.
3. Extreme events — the other half of the problem
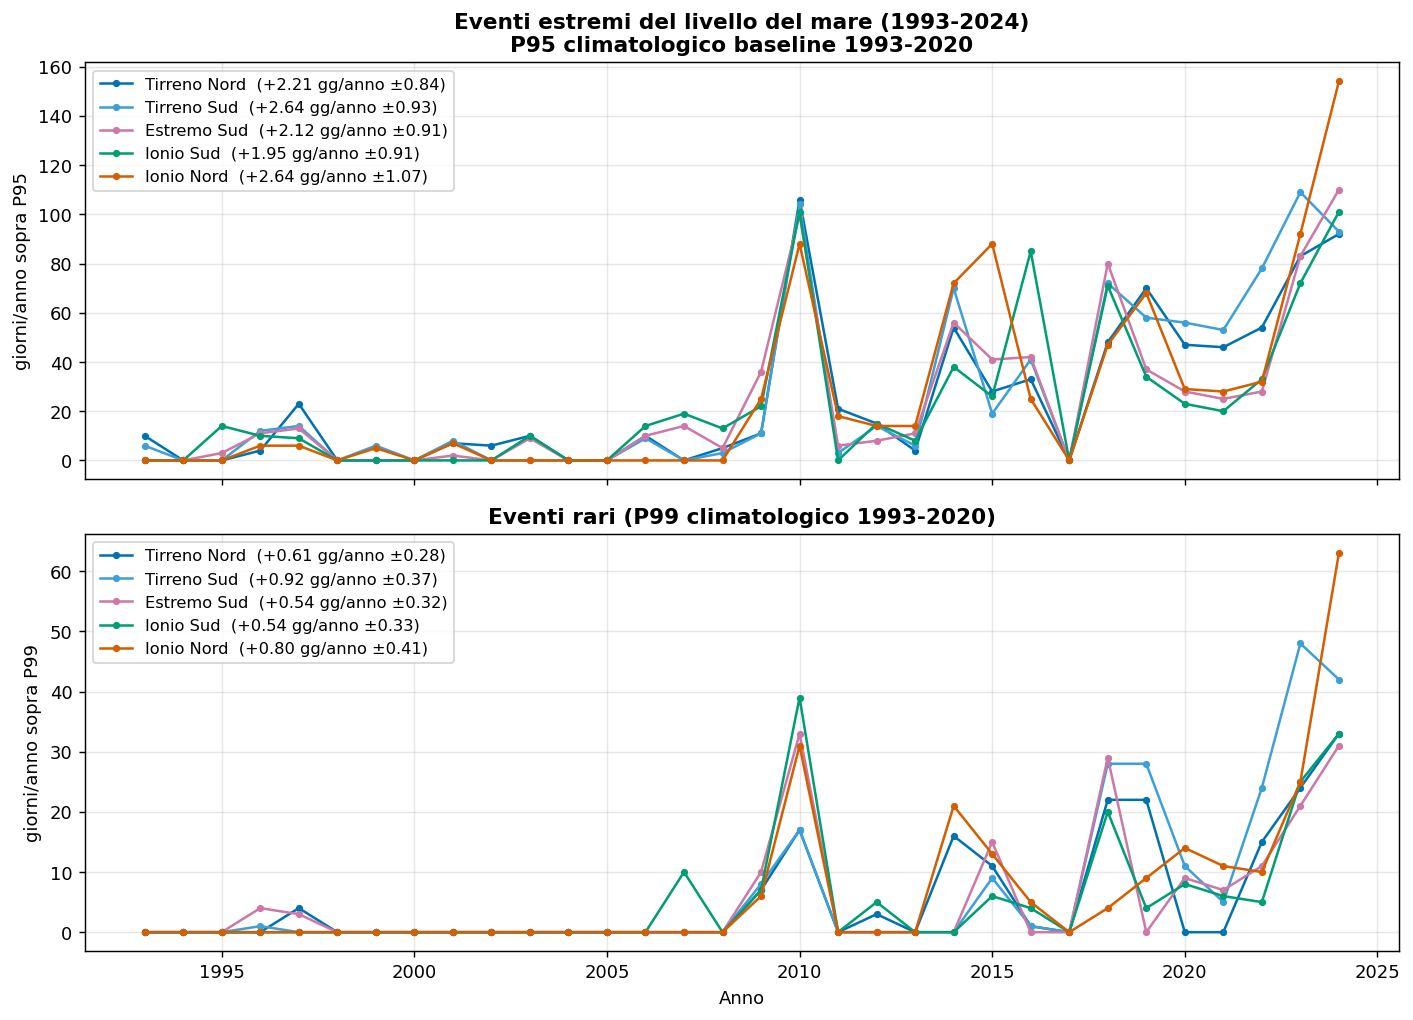
Real coastal erosion is not driven by the 3 mm/yr average trend, it is driven by storm peaks: 250-300 mm above norm in a few hours, that carve the shoreline in a single day. To measure intensity and frequency of these events, I counted for each year the number of days when sea level exceeded the 95th climatological percentile (P95, computed on the 1993-2020 period).
The theoretical expected value is about 18 days/yr above P95 (by construction, 5% of a year). Here is the value observed in 2024:
| Zone | days/yr > P95 (expected 18) | Factor | days/yr > P99 (expected 4) | Factor |
|---|---|---|---|---|
| Tirreno Nord | 92 | 5.1 × | 33 | 8.3 × |
| Tirreno Sud | 93 | 5.2 × | 42 | 10.5 × |
| Estremo Sud | 110 | 6.1 × | 31 | 7.8 × |
| Ionio Sud | 101 | 5.6 × | 33 | 8.3 × |
| Ionio Nord | 154 | 8.6 × | 63 | 15.8 × |
Extreme sea-level events on the Tyrrhenian and Far South are 5-10 times more frequent than during the baseline period. On the North Ionian they become 8-16 times more frequent. The transformation is substantial: an extreme storm-surge event that used to happen once a month in the reference period now happens once a week. For the beach that suffers it, this is the difference between having time to rebuild during the year and being eroded progressively without pause.
The trend is linear and statistically significant: along the 32 years of the series, every year P95 events increase by +1.95 to +2.64 days (depending on the zone), with the 95% CI always positive.
4. Validation with tide gauges (OMI)
To make sure satellite numbers are not an artefact of the gridding procedure or of some hydrostatic correction, I compare with the gold-standard: the RMN tide-gauge stations of the Italian Ministry of Defence, collected in the OMI product Extreme Sea Level Mediterranean. Calabria has two direct stations:
| Station | TYRN SEA zone | P99 2023 satellite | P99 2023 OMI in-situ | Delta |
|---|---|---|---|---|
| RMN-Messina | Estremo Sud | +229.8 mm | +230.0 mm | −0.2 |
| RMN-ReggioCalabria | Estremo Sud | +229.8 mm | +220.0 mm | +9.8 |
| RMN-Crotone | Ionio Nord | +235.8 mm | +220.0 mm | +15.8 |
The gap between satellite and tide gauge is within 15.8 mm on values of about 230 mm, i.e. less than 7% relative error. For RMN-Messina the agreement is almost perfect (−0.2 mm). It is a robust cross-domain validation: the satellite data reproduces the in-situ data within the precision margins of multi-mission altimetric measurement.
Comparison with non-Calabrian stations (Salerno, Palinuro, Taranto) shows larger gaps (−30 / −50 mm), but these are expected and are not satellite errors: they depend on the local geomorphology of the enclosed bays of Salerno (Gulf) or the Mar Piccolo of Taranto, where local extremes are higher because water accumulates in narrow basins. What the OMI comparison tells us is: for the open Calabrian coasts we have the same measurement within a few millimetres from both satellite and tide gauge.
5. Composite erosion-risk index
I synthesise the evidence in a single number per zone, the EOI — Erosion Onset Index. The formula combines three weighted components:
where norm(SLR) normalises the SLR trend on the plausible Mediterranean range [0.5; 5] mm/yr, norm(P95 events) normalises current days/yr P95 on the range [18 expected; 200 extreme], and vulnerability is a 0-1 index synthesised from Part 2 of this work (mean depth, % shelf <100m, dominant coast type).
The largest weight goes to extreme events (50%) because they are the ones that actually erode. The long-term average trend counts less (30%) because 3 mm/yr of average rise are absorbed by natural variability; the coastal vulnerability weighs 20% because it modulates the actual effect of the other two terms.
| Zone | SLR (mm/y) | days/P95 | Vulnerability | EOI | Class |
|---|---|---|---|---|---|
| Ionio Nord | +3.93 | 154 | 0.75 | 75.2 | High |
| Tirreno Sud | +3.47 | 93 | 0.85 | 57.4 | Moderate |
| Tirreno Nord | +3.53 | 92 | 0.50 | 50.5 | Moderate |
| Estremo Sud | +3.06 | 110 | 0.35 | 49.3 | Moderate |
| Ionio Sud | +2.91 | 101 | 0.40 | 46.9 | Moderate |
6. Zone-by-zone reading
Ionio Nord (Crotone-Sibari) — High risk
The most exposed area of Calabria. The SLR is the highest (+3.93 mm/yr), extreme events are 8-16 times more frequent than normal, and the geomorphology (Sibari alluvial plain + low-coast Crotone area, continental shelf <100m at 14%) amplifies the impact. Sibari has had a documented erosion problem since the 1970s; the EOI number confirms that the phenomenon is in structural acceleration. For this zone, urban planning and coastal-defence investments should be prioritised.
Tirreno Sud (Lamezia-Vibo) — Moderate risk (near High)
SLR is in the regional mean (+3.47), extreme events 5-10 times more frequent than normal, but vulnerability is the highest of the five zones (0.85): the Gulf of Sant'Eufemia is wide and shallow, the Lametino-Falerna strip has low sandy beaches, the continental shelves are reduced. The EOI of 57 places it just under the High threshold, but the margin is small: an SLR acceleration of another 0.5 mm/yr or a year of strong storms could move it into the red zone. It is the zone to monitor with most attention in the next five years.
Tirreno Nord (Cosenza Tyrrhenian) — Moderate risk
More mixed coast: rocky high stretches alternating with sandy beaches, average depth (494m). SLR (+3.53) and extremes (5-8 times the norm) are average, vulnerability intermediate (0.50). EOI of 50.5: ordinary attention situation. The most vulnerable stretches are the deltas of small torrents (Diamante, Belvedere) where solid input is decreasing due to upstream dams and the beach cannot compensate.
Estremo Sud (Strait-Reggio) — Moderate risk
Paradoxically, it is the zone with the lowest SLR (+3.06) and the most defensive physical features: predominantly rocky coast, strong currents of the Strait that mix and disperse accumulations, low vulnerability (0.35). The EOI of 49.3 reflects this robustness. The exception are the urban stretches of Reggio Calabria where urban torrents already documented as problematic on bathing water (Part 3) modify local coastal dynamics, but the effect is point-wise, not structural.
Ionio Sud (Locri-Soverato) — Moderate risk
Coast on average protected by a narrow shelf (6.1% <100m, the lowest) and by a very deep sea that disperses extremes. SLR is the lowest (+2.91), extreme events 5-8 times the norm. EOI 46.9, the lowest of the five zones. Consistent with what documented in Part 2: South Ionian is oceanographically less problematic than the other Calabrian coasts.
7. Limits
- Limited period: 32 years of satellite (1993-2024) are robust for the trend but not enough to separate the anthropogenic signal (greenhouse effect) from interdecadal variability (NAO, AMO). Another 20-30 years would be needed.
- Satellite resolution: 7 km. Sufficient for the zone mean, not for the single coastal point. The erosion of a 200-metre beach requires specific local analysis.
- Synthetic vulnerability: the vulnerability term of the EOI is a qualitative synthesis (bathymetry + coast type). A pointwise analysis for each shoreline would require detailed topographic surveys (LIDAR, historical aerial photos), beyond the scope of this work.
- Sub-hourly events: the satellite data is daily. Real storms last 6-12 hours: the hourly peaks are certainly higher than the daily ones shown here. For coastal safety modelling the hourly reanalysis data would be needed.
- Local subsidence: this study measures the sea level, not the shoreline retreat. In zones with subsidence (Sibari) the coast lowers also for local geological reasons, summing the effect to SLR. For Sibari the real risk is therefore probably higher than the EOI estimated here.
8. Conclusions
The sea in front of the Calabrian coast rises by +3 mm/yr on average, satellite validated against tide gauge within 7% error. More important than the average trend: extreme events have become 5-16 times more frequent than during the baseline period, and 2024 was the absolute record of the satellite series for each of the five zones. Erosion is therefore an ongoing process, not a future risk.
Ionio Nord (Sibari-Crotone) emerges as the highest structural-risk zone (EOI=75) by combination of trend, frequency of extremes and geomorphological vulnerability. Tirreno Sud (Lamezia) is the case to monitor with the most attention because its high vulnerability makes it sensitive to future SLR accelerations.
This report closes the six-dimensional picture of TYRN SEA: sea temperature (Part 1), physical coast differences (Part 2), historical bathing waters (Part 3), biogeochemistry (Part 4), social confirmation (Part 5), sea level and erosion (Part 6). Six independent pieces telling the same story from complementary angles: the Calabrian sea is in measurable transformation, and the public data available is sufficient to say so with precision.