Foreword
This document reconstructs the microbiological quality of bathing waters along the Calabrian coast, combining two public sources:
- the real-time data of the Italian Ministry of Health's Bathing Waters Portal (the current 2026 season and the previous 2025 season), which holds the individual samples collected by the local health authorities (ASL);
- the harmonised historical dataset of the European Environment Agency (EEA), which from 1990 to 2024 provides the annual quality classification of every European bathing area.
The aim is to understand where the problem areas are concentrated, whether they are persistent or transient, whether the distribution differs between the Tyrrhenian and the Ionian coasts, and which factors (river mouths, harbours, urban density) explain the patterns. The analysis complements the earlier study of the marine environmental parameters (sea surface temperature, wind, mucilage preconditions), allowing cross-readings.
A methodological note: this study does NOT replace the official assessments of the local health authorities, nor the bathing ordinances. The data reported here are public, but operational decisions remain the responsibility of the competent authorities. The interpretations proposed here are the result of personal statistical processing and should be read as hypotheses to be confirmed with more specific environmental data (population equivalent served, treatment-plant capacity, river discharge, etc.).
Glossary of acronyms and technical terms
The main terms and acronyms used in the document are listed here.
| Term / Acronym | Meaning |
|---|---|
| BWD | Bathing Water Directive - European Directive 2006/7/EC on the quality of bathing water. It sets out how each Member State must identify, monitor and classify waters used for bathing. |
| EEA | European Environment Agency. It publishes annually the harmonised dataset of the BWD classifications of all Member States (1990 to present). |
| Legislative Decree 116/2008 | The Italian decree that transposes the BWD. It defines what is (and what is NOT) a bathing water, the regulatory parameters and the sampling procedures. |
| Bathing water | Under Italian law, any stretch of coastal water, lake, river or estuary designated by local authorities for bathing and where a large number of bathers is expected. Areas that are NOT designated (e.g. river mouths, harbours, military areas, discharge points) are excluded a priori - they are neither 'bathing' nor 'non-bathing' waters. |
| E. coli (Escherichia coli) | A bacterium found in the intestine of mammals (humans included). Its presence in water indicates faecal contamination, and therefore the possible presence of more dangerous pathogens. Regulatory limit for bathing-water quality: 500 cfu/100ml (used here for the standard Calabrian areas). |
| Intestinal enterococci | A bacterial family that is also an indicator of faecal contamination. More resistant than E. coli in sea water, hence a complementary indicator. Regulatory limit: 200 cfu/100ml. |
| cfu (colony forming units) | The measure used in microbiology to count viable bacteria. cfu/100ml = the number of bacterial colonies per 100 ml of water. |
| BWD quality classes | The four final classes into which each area is classified at the end of the season: 1 = Excellent, 2 = Good, 3 = Sufficient, 4 = Poor. The classification takes into account the last four years of monitoring. Areas in the 'Poor' class MUST be closed to bathing for the following season. |
| Exceedance (single sample) | When a single sample exceeds the regulatory limits for E. coli or enterococci. It does not immediately trigger a ban, but it triggers a re-sampling and contributes to the end-of-season classification. |
| ASL | Azienda Sanitaria Locale - the local health authority that carries out the mandatory sampling (one before the season plus at least three during it, every four weeks). |
| ARPACAL | The Regional Environmental Protection Agency of Calabria. It works with the local health authorities on the analytical checks and manages some of the regional monitoring networks. |
| Bathing water profile | A descriptive document (PDF) produced and updated by the Regions that characterises each bathing area: physical description of the beach, potential contamination sources, management, etc. Available online on the Ministry's Bathing Waters Portal. |
| River mouth | The point where a river flows into the sea. By law the stretch of sea in front of a river mouth is EXCLUDED from bathing waters, because it is considered structurally unsafe (untreated freshwater inflow). The adjacent stretches of sea can, however, be indirectly affected, especially after rainfall. |
| Commercial harbour | Also EXCLUDED from bathing waters (collision risk, oils, logistics activity). The adjacent stretches can nonetheless be affected by residual pollution. |
| ISTAT | The Italian National Institute of Statistics. It provides the municipal codes used in the official datasets (six-digit code). |
1. Data sources and methodology
1.1 What is (and what is NOT) a bathing water
Italian legislation (Legislative Decree 116/2008) transposes European Directive 2006/7/EC: each Region identifies every year the areas where bathing is expected - typically the beaches - and entrusts the local health authorities with monitoring them through periodic sampling. Each area has precise geographical boundaries and a name (e.g. 'BAR VITTORIA', 'LIDO COMUNALE'), corresponds to a sampling point and has its own history.
By law the following are excluded a priori from the definition of bathing water:
- the mouths of rivers and streams (uncontrolled freshwater inflow, often polluted by upstream discharges);
- harbour areas and the stretches of sea used for vessel manoeuvring (risk of accidents, oils, technical discharges);
- military and national-security areas;
- discharge areas (treatment plants, submarine outfalls).
This clarification is important in order to read the data without misunderstandings: the 'critical' points are never a river mouth or a harbour as such, because these are simply never classified. The problems that emerge from the data concern bathing areas adjacent to contamination sources (a beach club near a river mouth, an urban beach crossed by a discharge into the sea). This is a crucial point for correctly interpreting the results for Reggio Calabria, presented in Chapter 4.
1.2 The two datasets used
The analysis draws on two complementary sources, both public:
Source 1: Bathing Waters Portal of the Italian Ministry of Health (current and previous season)
The web portal at www.portaleacque.salute.gov.it makes the data of the last two bathing seasons available for consultation. For each area one can see the individual samples with the date, the measured values of E. coli and intestinal enterococci, and whether they exceeded the regulatory limits.
The portal does not offer a documented API, but the calls used internally were reconstructed by analysing the JavaScript code of the map page. The following endpoints were identified:
- ricercaComuni - searches municipalities by name (JSON format);
- ricercaAreeBalneazione - lists the bathing areas of a municipality;
- datiArea - returns the registry data plus the current-season analyses and the previous-season history for each area.
The ingestion script (acque_calabria.py) enumerates all 362 Calabrian municipalities, identifies the coastal ones (114) and downloads, for each of their bathing areas, the complete list of samples. These ministerial data are complemented by the provincial xlsx files published weekly by ARPACAL, which notably include the supplementary re-sampling events that follow an exceedance — useful to reconstruct the actual duration of each non-conformity event. In total, 6,080 individual microbiological analyses from the 2025 and 2026 seasons were loaded into the local SQLite database.
Source 2: EEA Bathing Water Directive (1990-2024)
The European Environment Agency publishes every year a harmonised dataset of the annual classifications of all bathing waters of the 27 Member States (over 22,000 areas). The dataset, freely downloadable, covers the historical series 1990-2024 in Excel format.
Unlike the Italian portal, the EEA does not report the individual samples, but a single row per area per year with the final classification in four categories (Excellent / Good / Sufficient / Poor). It is therefore the best way to reconstruct 35 years of history.
The mapping between the area code used by the Ministry (e.g. '1864') and the EEA identifier (e.g. 'IT018079047004') was reconstructed through the URL of the bathing-water profile PDF, which is named according to the EEA standard. The Calabria region has EEA code '018'.
1.3 Processing pipeline
The whole process is automated in four Python scripts:
- acque_calabria.py - downloads from the Ministry of Health portal and populates the municipalities, bathing-areas, analyses and bans tables in SQLite.
- acque_eea.py - loads the EEA Excel dataset, maps the identifiers to the Italian codes, and populates the qualita_eea table.
- analisi_balneabilita_coste.py - computes statistics by coastal zone, produces the overview map, historical heatmaps, the Poor trend, and the 'hall of shame' and 'redemption' tables.
- analisi_balneabilita_dettaglio.py - adds the river mouths and harbours to the map, produces the Reggio Calabria zoom, and analyses the temporal pattern of the metropolitan area.
The final SQLite database (acque_calabria.db) contains: 362 municipalities, 595 bathing areas (of which 560 are active today), 6,080 recent analyses, and 21,564 historical EEA rows. The whole pipeline is reproducible and can be re-run at any time to update the data.
2. Overall picture for Calabria - current and previous season
The picture of the 2025 (complete) and 2026 (ongoing) bathing seasons is on the whole positive for Calabria: 560 active bathing areas out of 595 total (94%), 6,080 analyses carried out and 118 exceedances detected (1.9% of the total). The regional average is low, but it conceals strong differences between coasts.
2.1 The four coastal zones
For the comparison, the same division into four zones used in the previous study on sea temperature is adopted:
- TYRRHENIAN - from Praia a Mare to Scilla (longitude 15.60-16.30, latitude 38.25-39.95);
- FAR SOUTH - from Scilla to Bovalino, including the Strait of Messina and the metropolitan area of Reggio Calabria (latitude 37.85-38.25);
- SOUTH IONIAN - from Bovalino to Crotone (longitude 16.30-17.20, latitude 37.95-39.05);
- NORTH IONIAN - from Crotone to Roseto Capo Spulico, up to the border with Basilicata (latitude 39.05-39.95).
Each bathing area was assigned to a zone on the basis of its geographical coordinates (latitude and longitude). The overall summary:
| Zone | Areas | % Excellent years (1990-2024) | % Poor years (1990-2024) | Analyses 25-26 | Exceedances | % exceedances |
|---|---|---|---|---|---|---|
| Far South (Scilla -> Bovalino) | 80 | 74.4% | 7.87% | 800 | 63 | 7.88% |
| North Ionian (Crotone -> Roseto) | 148 | 90.2% | 1.18% | 1522 | 28 | 1.84% |
| South Ionian (Bovalino -> Crotone) | 125 | 94.9% | 1.23% | 1294 | 8 | 0.62% |
| Tyrrhenian (Praia -> Scilla) | 239 | 86.2% | 3.14% | 2433 | 19 | 0.78% |
Three observations emerge from the table:
- The SOUTH IONIAN is by far the best zone: 94.9% of area-years in the Excellent class over the 35 years of EEA history, and only 0.62% of exceedances in the last two seasons. Essentially, along the Bovalino-Crotone stretch there have practically never been bathing-water problems.
- The NORTH IONIAN and the TYRRHENIAN are around the average: 90.2% and 86.2% of historical Excellent area-years respectively, with low exceedances (<2%) in the recent seasons.
- The FAR SOUTH is the problem zone: historically 7.87% of area-years in the Poor class (six to seven times the regional average!), and in the recent seasons 7.88% of the analyses are above the limits. The next chapter focuses on this zone.
2.2 Overview map of Calabria
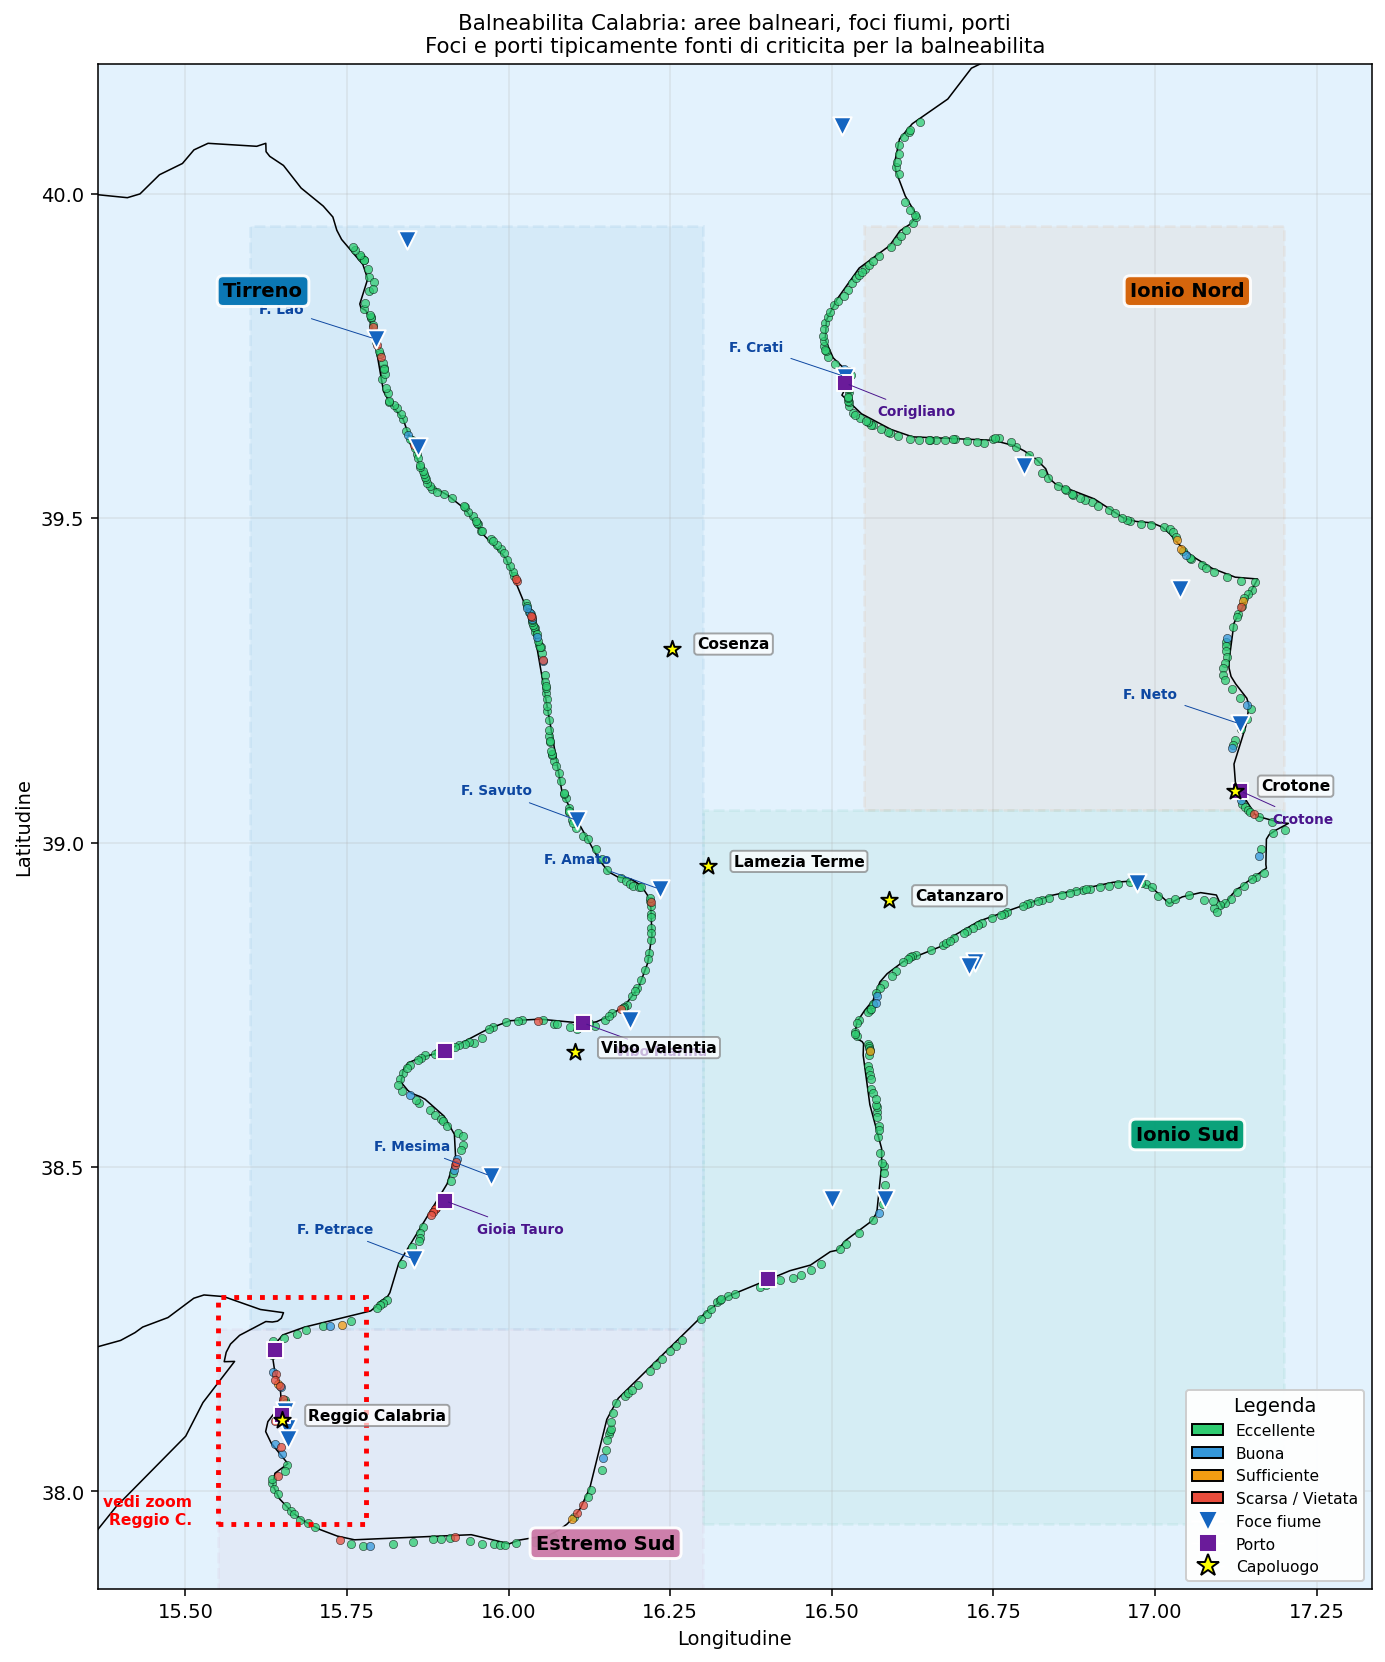
Figure 1 - Map of Calabria with all the bathing areas (592 with coordinates available) coloured by the quality class of their latest classification. The four coastal zones are highlighted by coloured dashed lines. Light-blue triangles = mouths of the main Calabrian rivers. Purple squares = commercial harbours. The red box highlights the Reggio Calabria detail area.
How to read the map
Most areas are green (Excellent class), as expected given that at the regional level 90% of area-years are historically Excellent. However, two concentrations of red dots (Poor class or banned) can be seen:
- a dense series in the Far South zone, around the city of Reggio Calabria, on the Strait of Messina;
- a few isolated points on the Tyrrhenian coast, such as the one near the mouth of the Mesima (near Rosarno - Gioia Tauro) and other sporadic ones.
The light-blue triangles (river mouths) are distributed fairly evenly between the Tyrrhenian and the Ionian coasts, but the Calabrian rivers differ in discharge: the Crati (northern Ionian) and the Mesima (Tyrrhenian) are among the most important by catchment area, and it is no coincidence that the bathing areas around their mouths tend to have more problems.
2.3 Comparison of the four zones (visualisation)
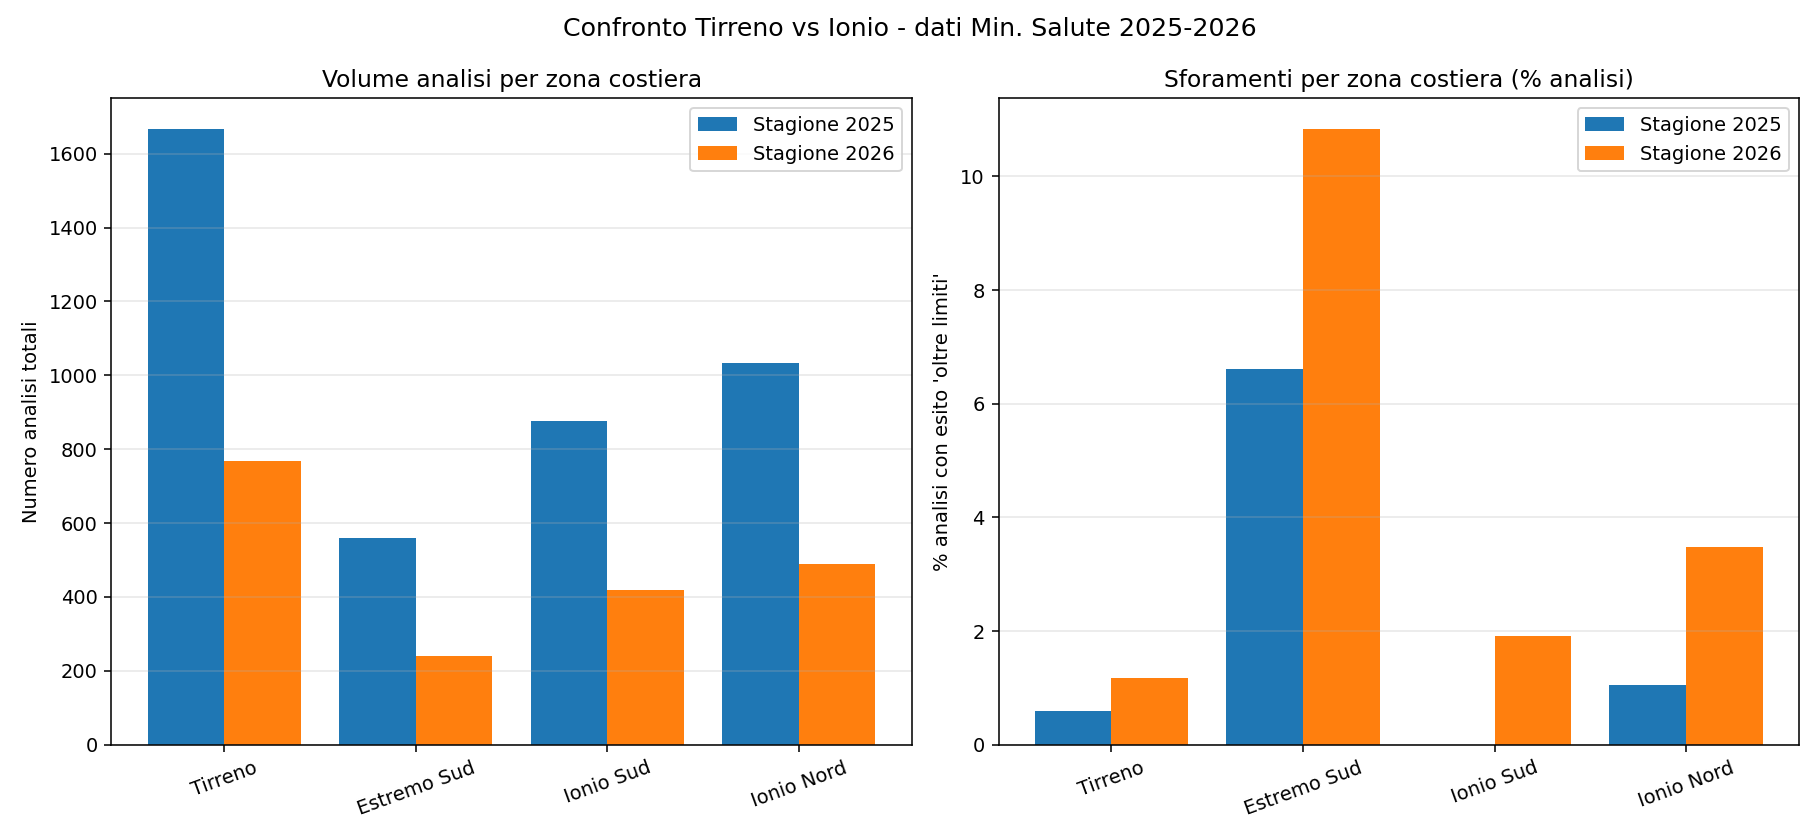
Figure 2 - Comparison of the number of analyses (left) and the percentage of exceedances (right) for each coastal zone, separately for the 2025 and 2026 seasons. Source: Ministry of Health Bathing Waters Portal, data as of May 2026.
The right-hand panel shows clearly that the Far South has a percentage of exceedances an order of magnitude higher than the other three zones, both in 2025 and in 2026. The other three zones are practically equivalent to each other, all below 2%. The 2026 season is still ongoing at the time of writing (it is May), so the 2026 figures should be read as partial.
3. The 1990-2024 history by coastal zone
The EEA dataset makes it possible to see how the classification of each bathing area changed year by year over 35 years. The granularity is annual (not per individual sample), and the Italian data are complete and reliable from 1992 onwards (in the years 1990-1991 many areas are still 'not classified' because the BWD was not yet fully operational).
3.1 Trend in the percentage of 'Poor' areas by zone
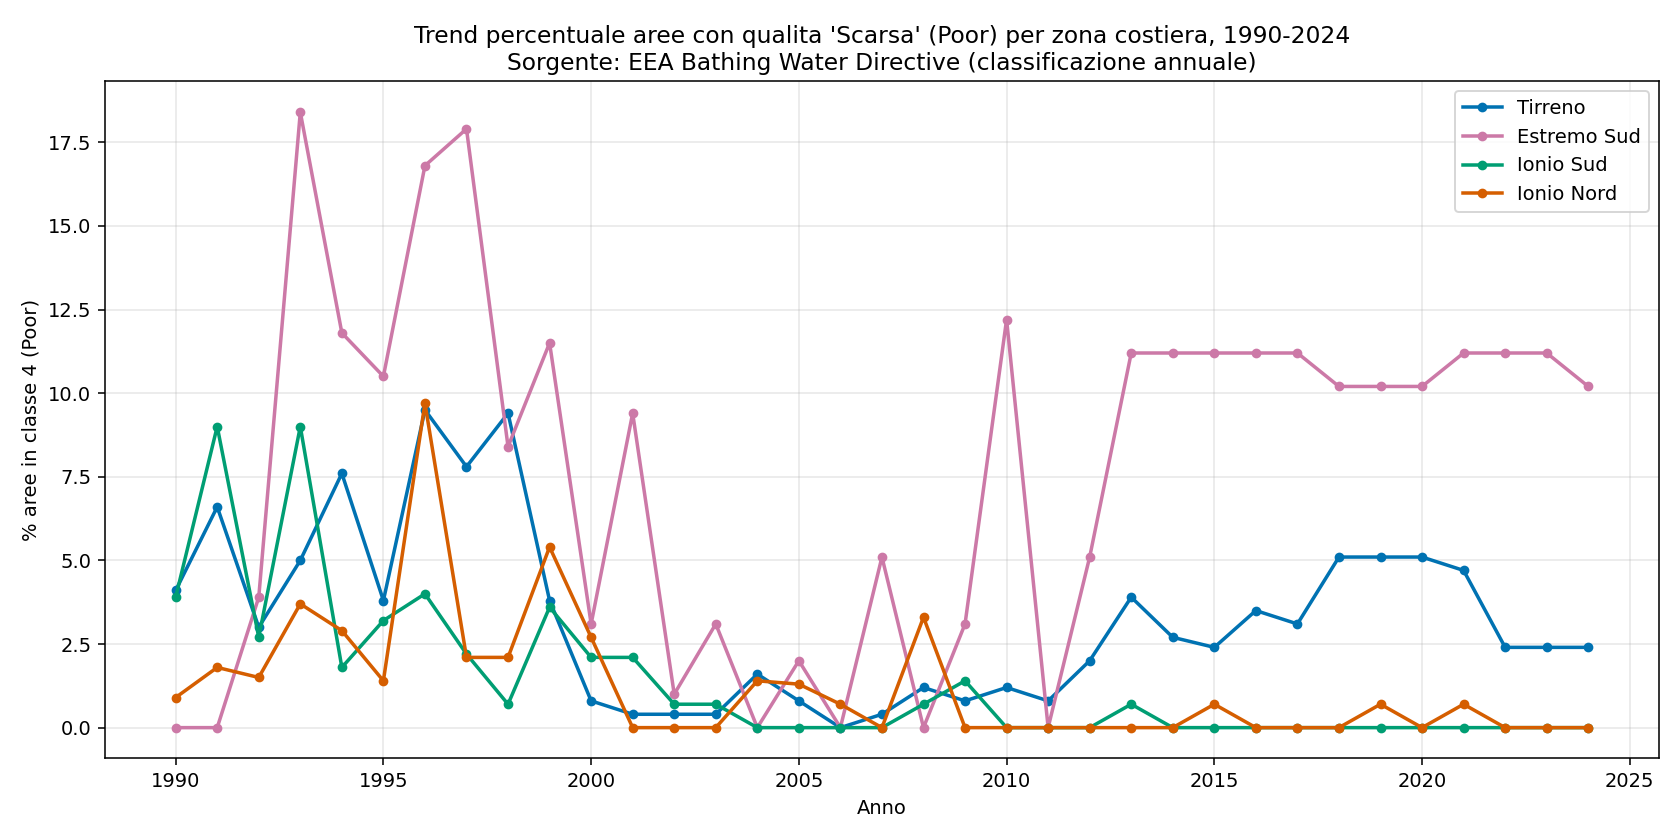
Figure 3 - Percentage of bathing areas classified 'Poor' each year, from 1990 to 2024, separately for the four coastal zones.
How to read the chart
The chart tells a story in three phases:
- The 1990s (1990-2000): all coasts show significant percentages of Poor areas (5-12%), with the Far South reaching striking peaks (up to 17% in 1996-1997). This reflects the state of wastewater treatment in the Italian coastal municipalities: many treatment plants were undersized or absent, and domestic discharges ended up in the sea practically untreated;
- The 2000s (2001-2010): an improving trend is visible on all coasts, in particular on the Tyrrhenian and the Ionian. This coincides with major national and European investment in treatment works (POR programmes, Water Protection Plans);
- The years 2010-2024: the situation stabilises. The South and North Ionian are almost always at zero. The Tyrrhenian fluctuates around 3-5%. The Far South remains STRUCTURALLY around 10-12%, with no significant improvement in the last decade.
The 'stability' of the Far South over the last 15 seasons is the worrying figure: it indicates that the problems are not episodic (a particularly rainy year, a one-off failure) but structural (an infrastructure problem that the improvement of the last 30 years has not solved).
3.2 Heatmap by coastal zone
For each coastal zone a 'heatmap' is provided: a matrix in which each row is a bathing area and each column a year (from 1990 to 2024). The colour of each cell indicates the classification of that area in that year: green = Excellent, blue = Good, orange = Sufficient, red = Poor, grey = not classified. The areas are ordered from the worst (at the top) to the best (at the bottom). At a glance one can see the 'red stripes' that identify the historically most problematic areas.
Tyrrhenian
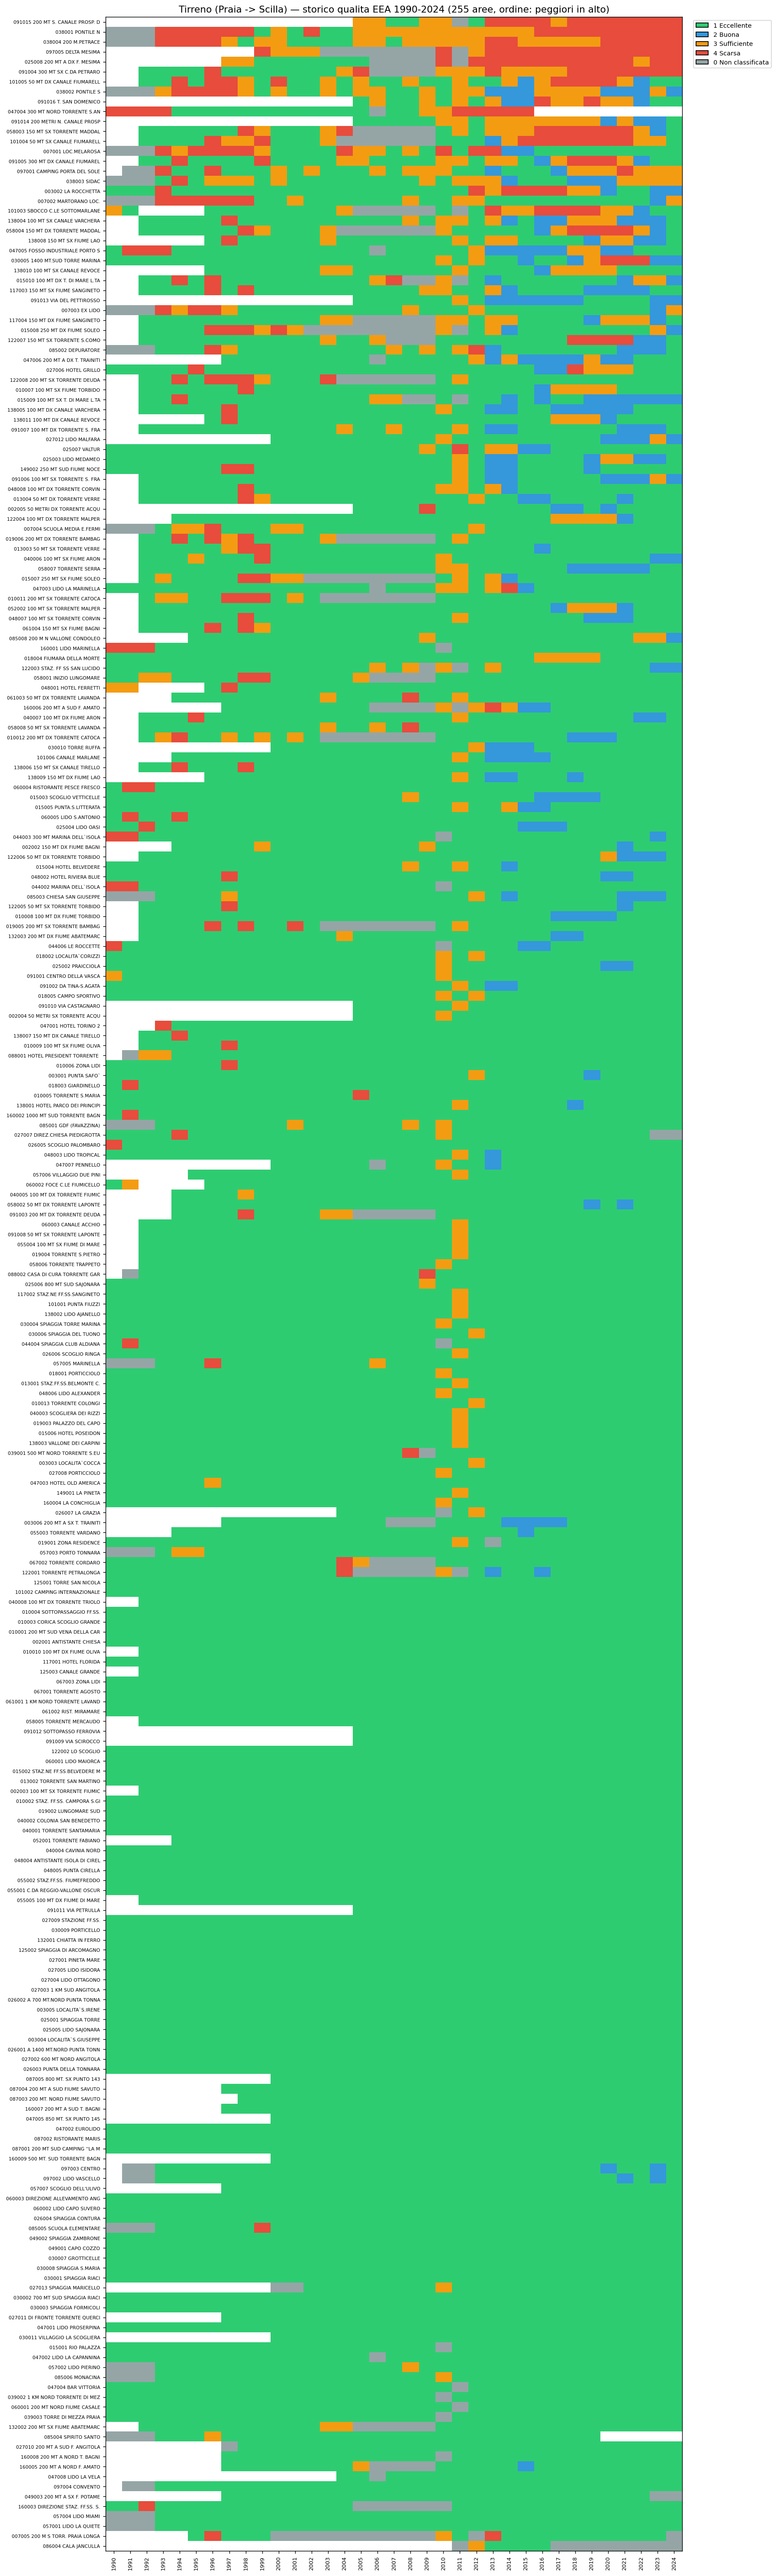
Figure 4a - Calabrian Tyrrhenian coast: historical quality heatmap 1990-2024 for the 255 bathing areas of the zone.
On the Tyrrhenian coast most areas are predominantly green (Excellent). However, a red band is visible in the upper part of the heatmap: about ten areas with recurring problems, concentrated mainly around the mouth of the Mesima (Rosarno - Gioia Tauro) and in a few municipalities of the Cosenza area. These areas often show a clear improvement after 2010, but then worsen again in some years.
Far South (Reggio Calabria)
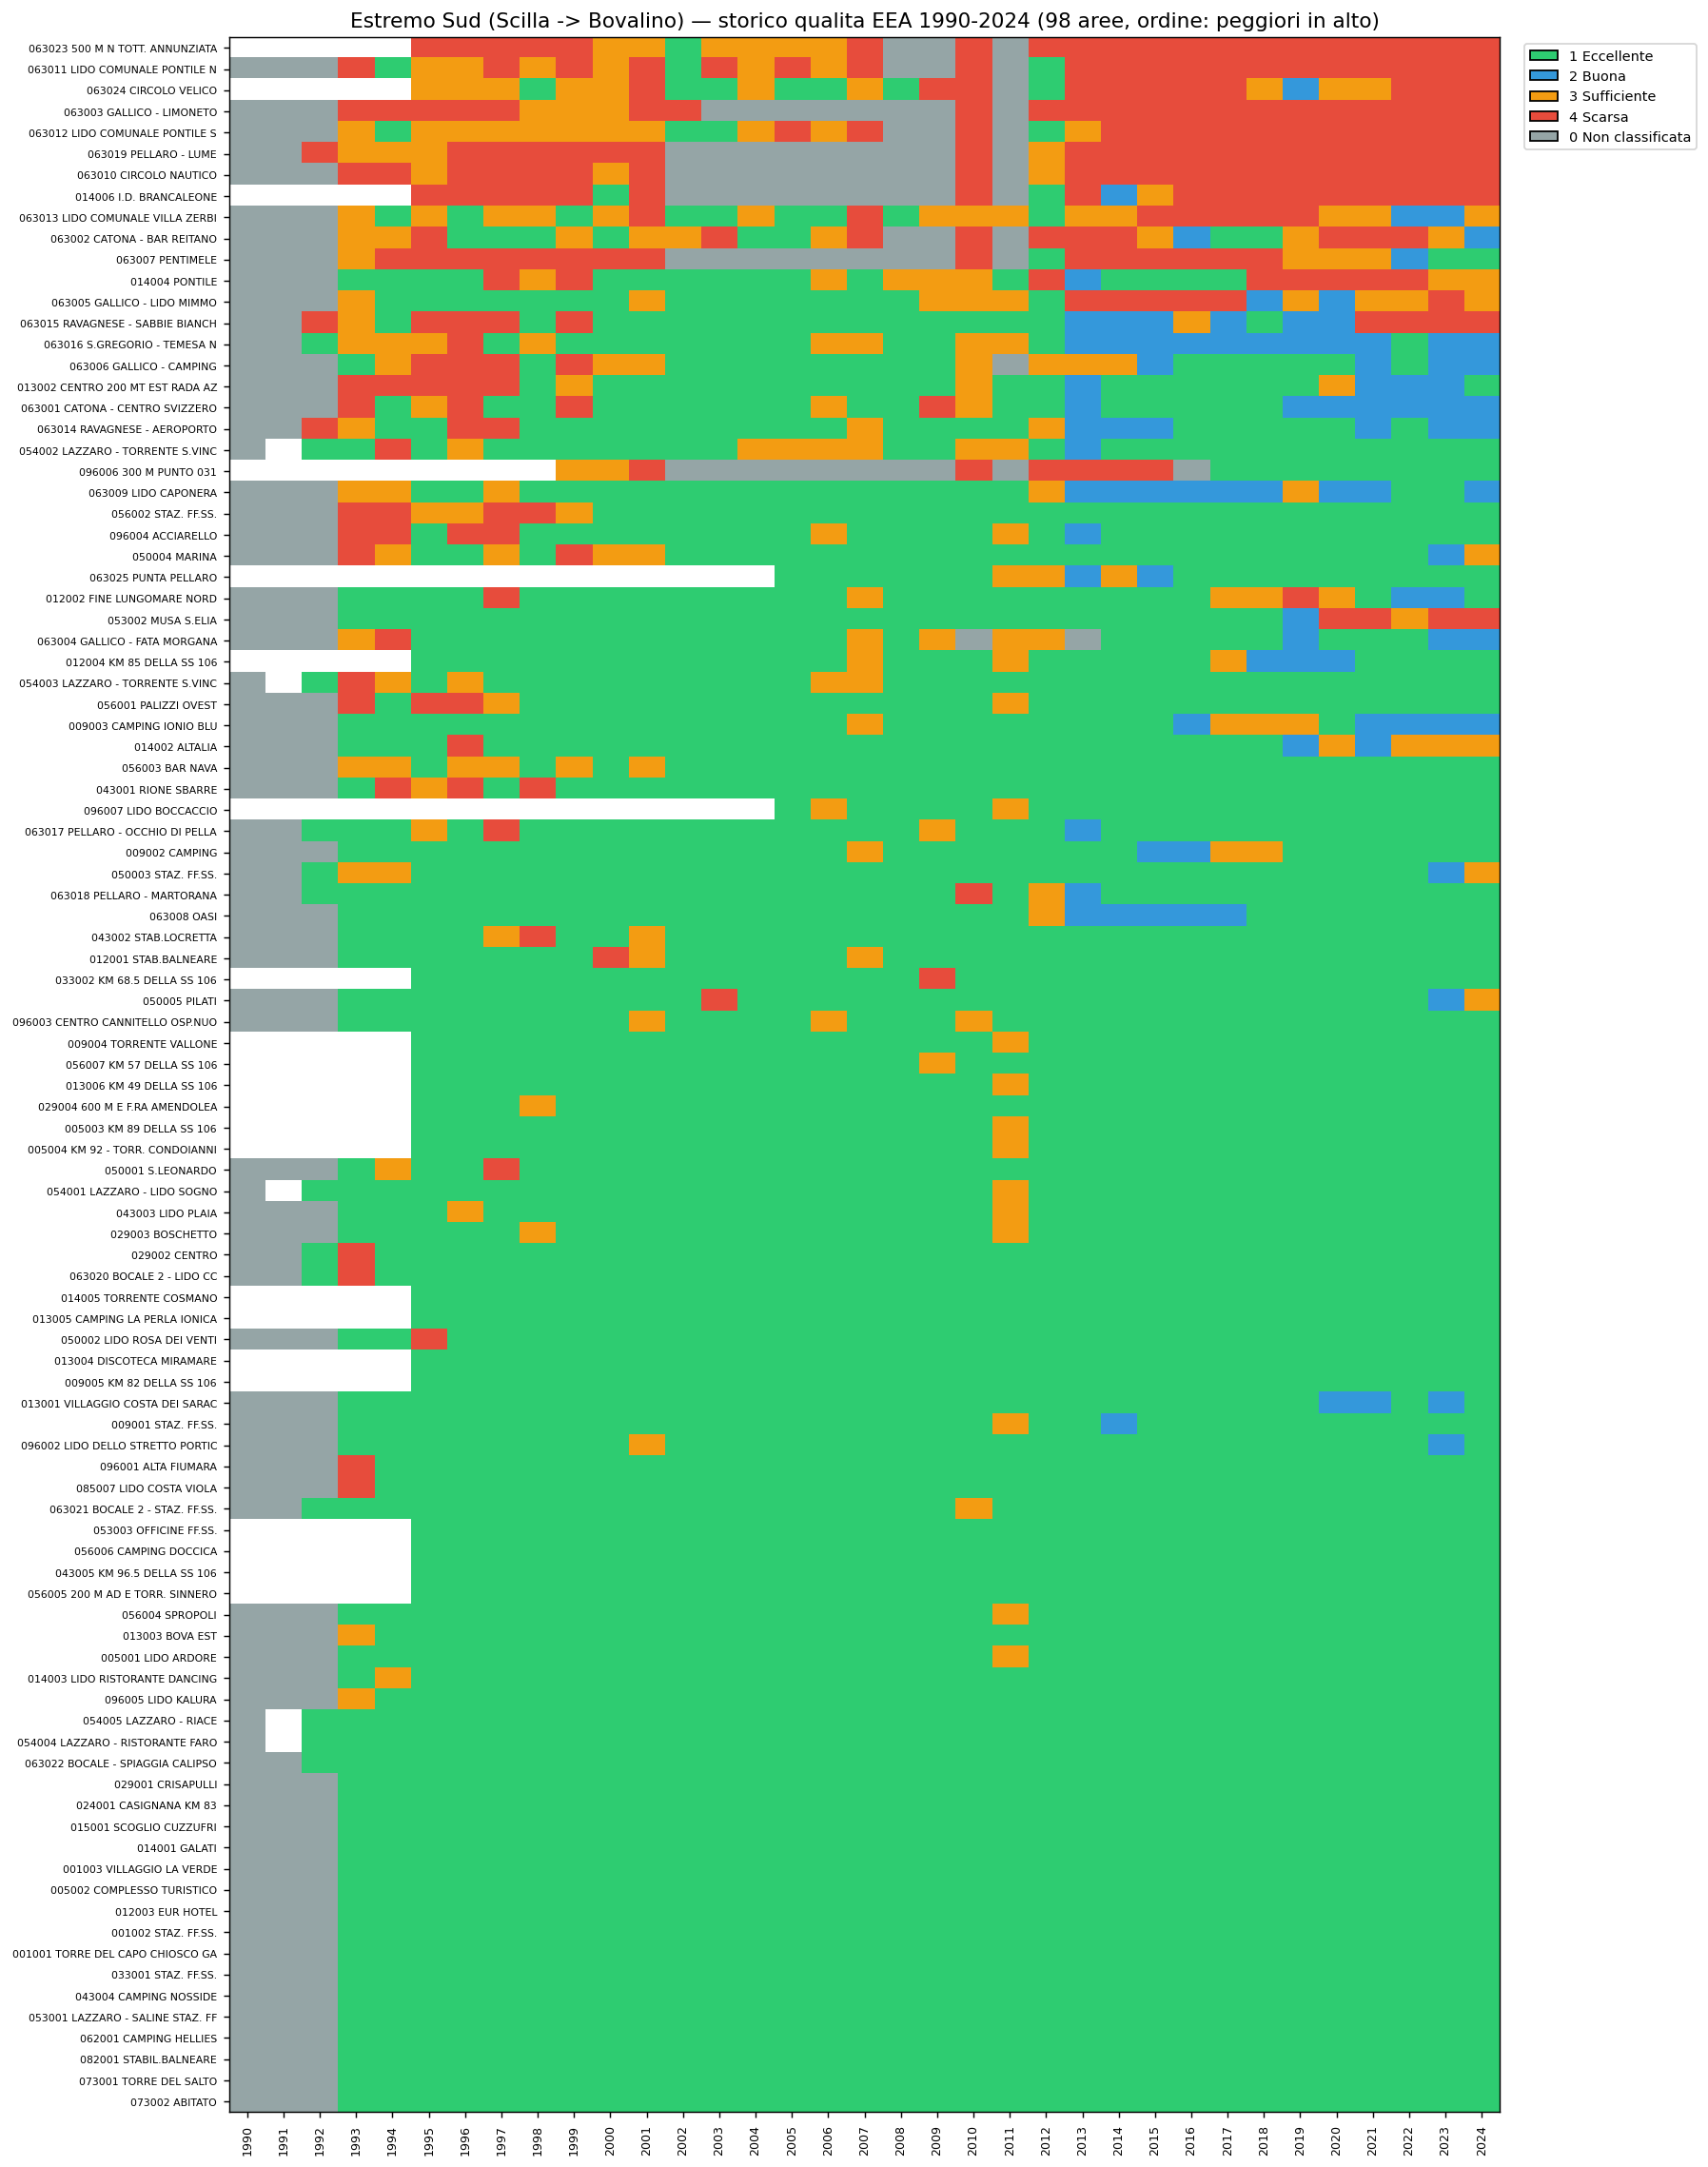
Figure 4b - Far South: historical quality heatmap for the 98 bathing areas of the zone, mainly in the municipality of Reggio Calabria.
The picture here is far more critical. A wide red band is visible that persists for more than twenty years - these are the bathing areas of the Strait, within the urban area of Reggio Calabria. No substantial improvement over time can be seen. Chapter 4 is devoted exclusively to the analysis of this zone.
South Ionian
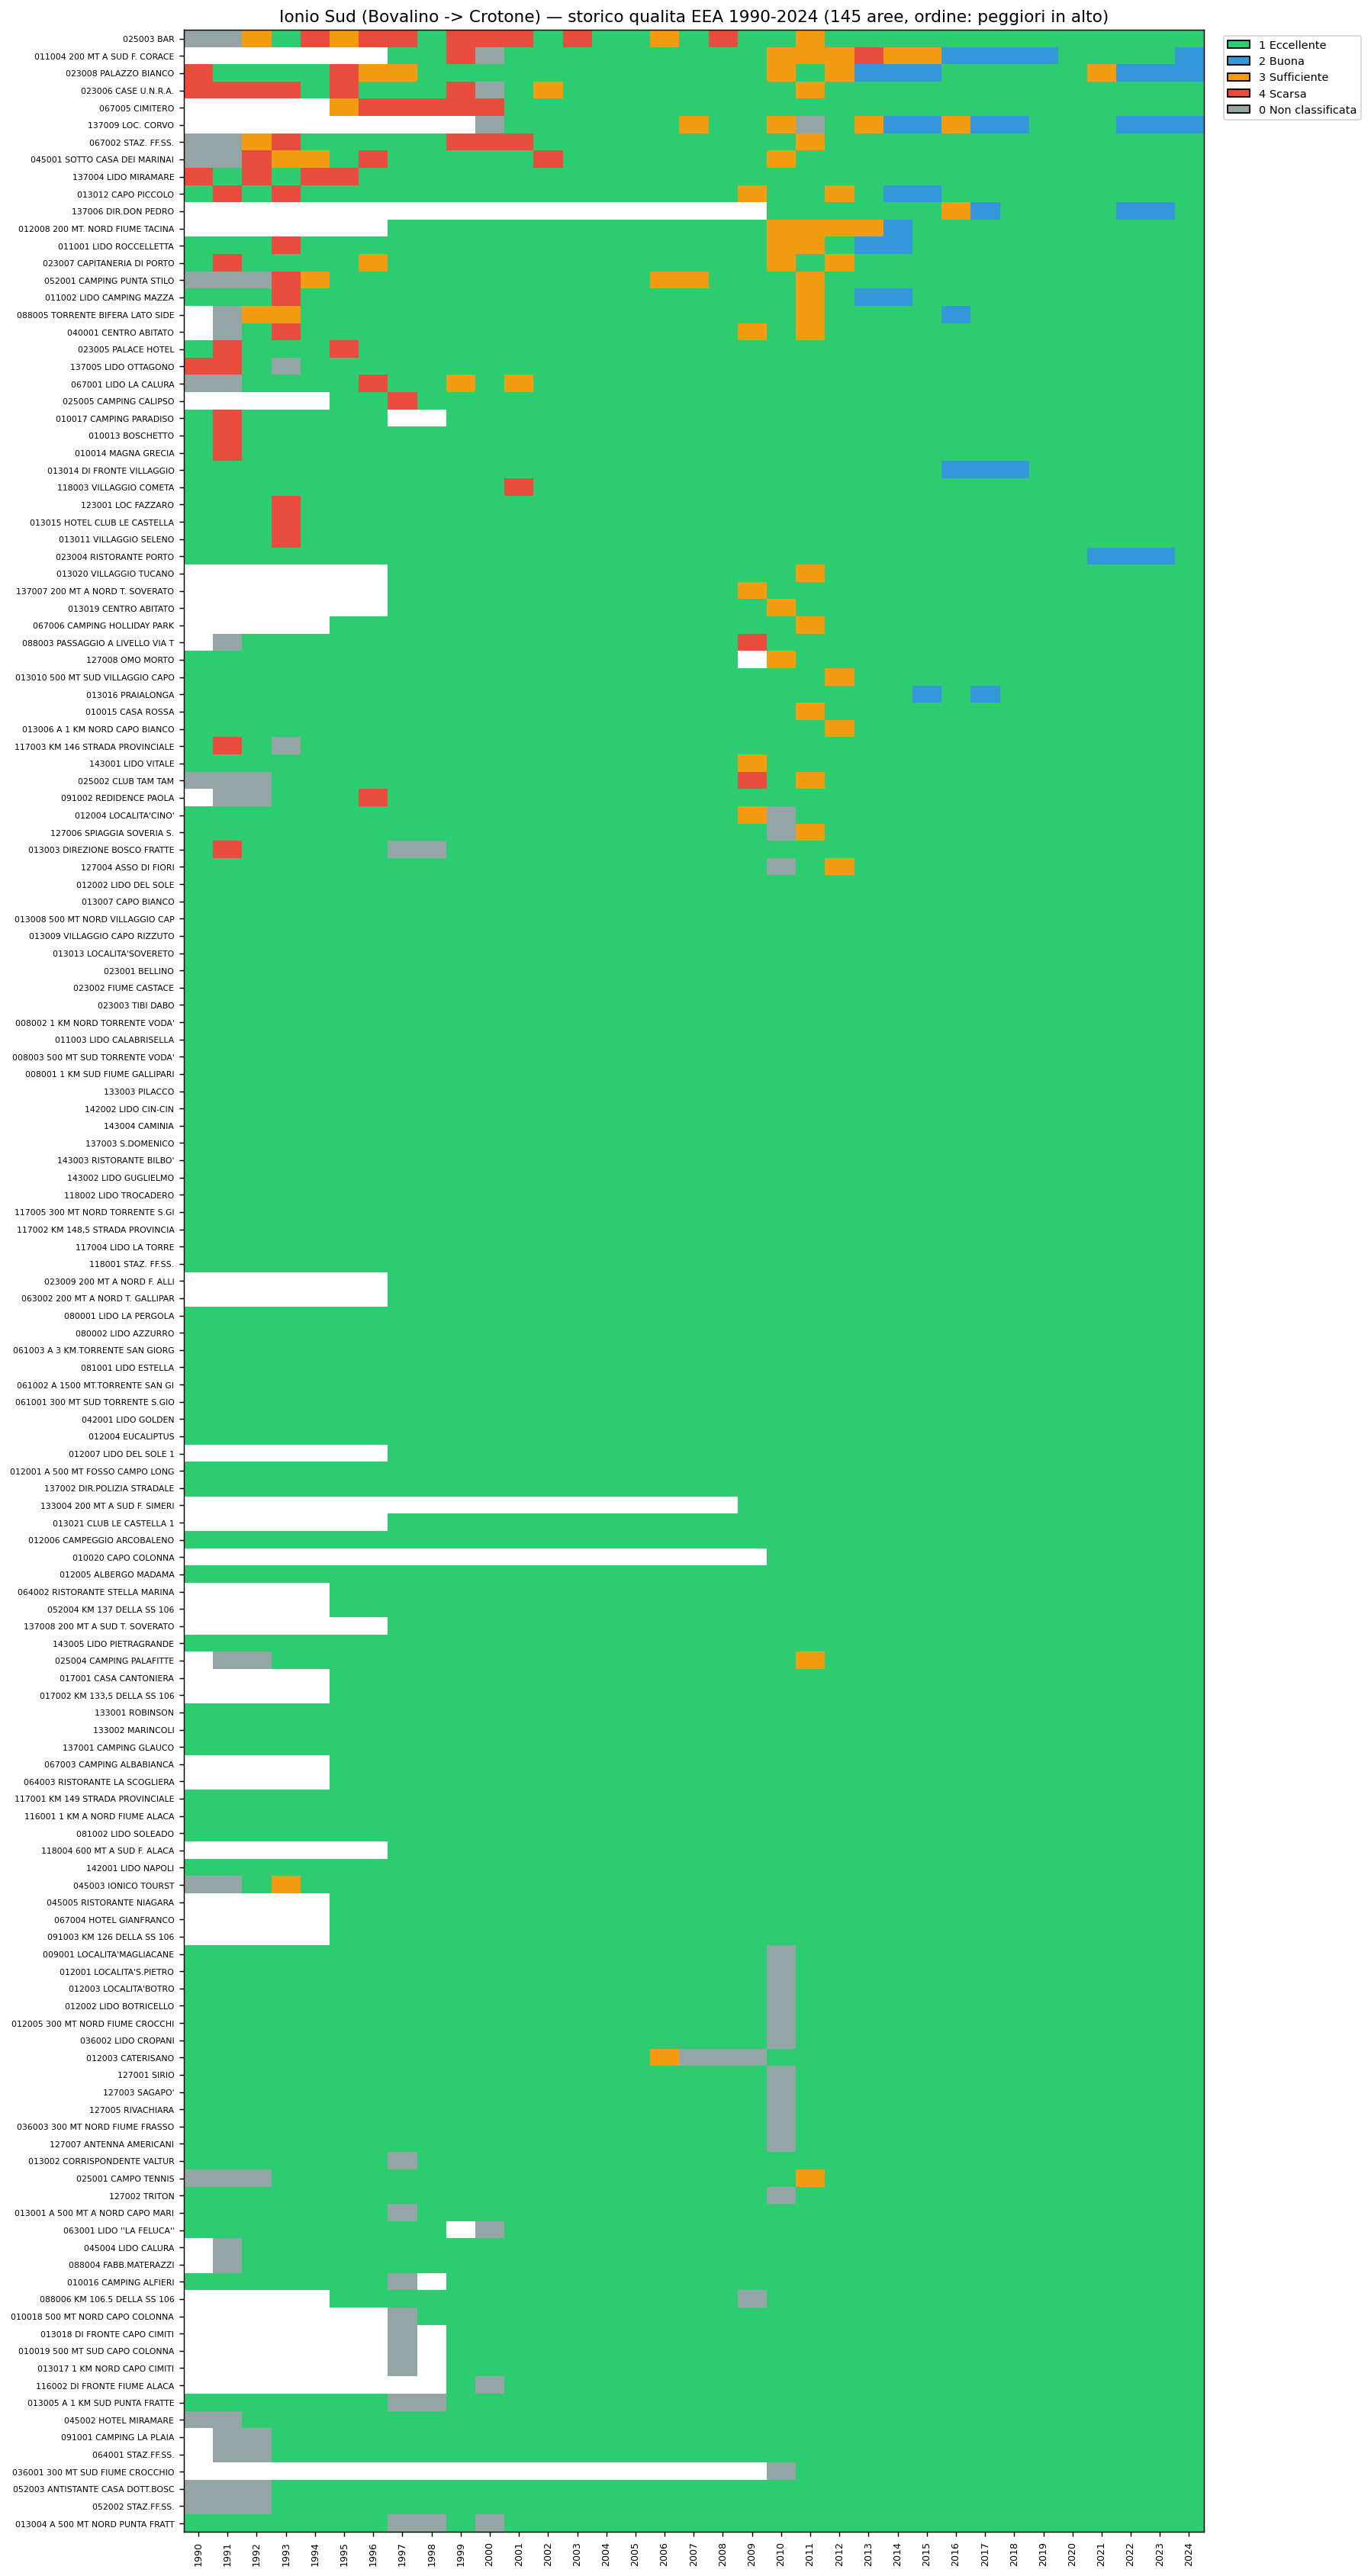
Figure 4c - South Ionian (Bovalino - Crotone): quality heatmap for the 145 bathing areas.
The South Ionian is the 'cleanest' zone of Calabria: the heatmap is almost entirely green. Very few rows show red periods, and these are typically single isolated years, not persistent patterns. This confirms the ranking of the table on the previous page.
North Ionian
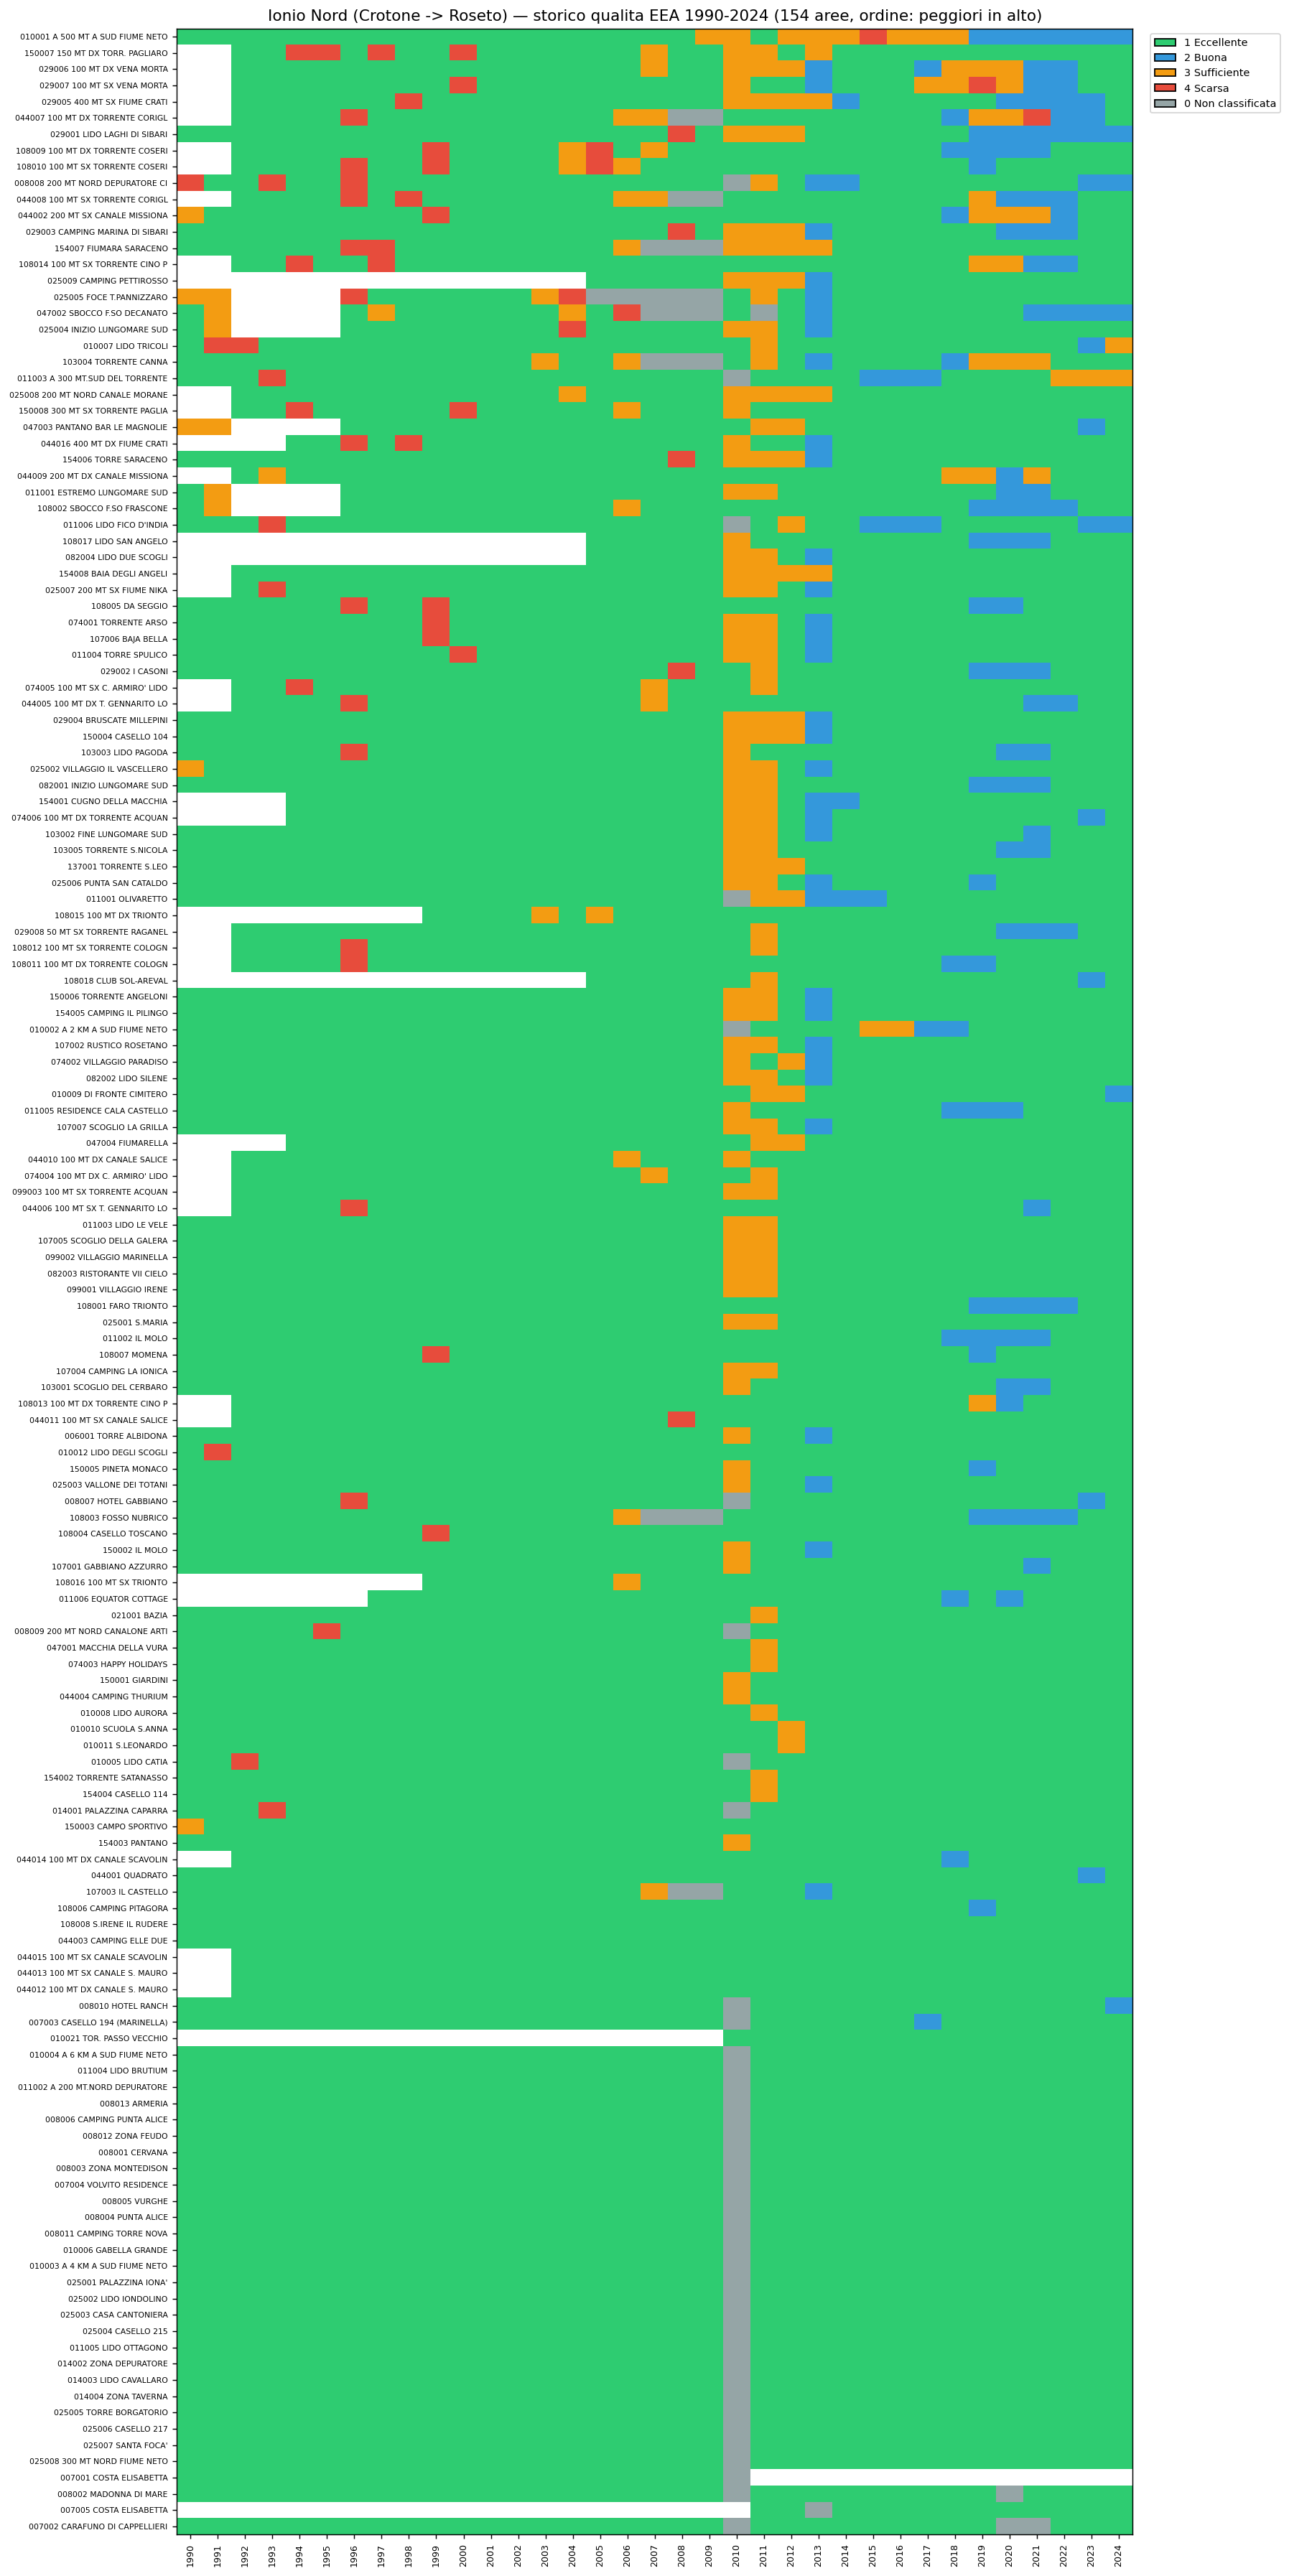
Figure 4d - North Ionian (Crotone - Roseto): quality heatmap for the 154 bathing areas.
The North Ionian too is predominantly green, with a few red stripes around the mouth of the Crati (Sibari) and in some municipalities of the eastern Cosenza area. Better conditions than the Tyrrhenian.
3.3 The 'Hall of Shame': the historically most problematic areas
Over the 35 years of history, there are 203 Calabrian bathing areas that have had at least one year with a Poor classification. The table lists the first 10 by cumulative years in Poor.
| Area name | Zone | Poor years / total | % Poor | First Poor year | Last Poor year |
|---|---|---|---|---|---|
| GALLICO - LIMONETO | Far South | 21/35 | 60.0% | 1993 | 2024 |
| PELLARO - LUME | Far South | 20/35 | 57.1% | 1992 | 2024 |
| CIRCOLO NAUTICO | Far South | 20/35 | 57.1% | 1993 | 2024 |
| LIDO COMUNALE PONTILE N | Far South | 20/35 | 57.1% | 1993 | 2024 |
| 500 M N TOTT. ANNUNZIATA | Far South | 20/30 | 66.7% | 1995 | 2024 |
| I.D. BRANCALEONE | Far South | 17/30 | 56.7% | 1995 | 2024 |
| PONTILE N | Tyrrhenian | 16/35 | 45.7% | 1993 | 2024 |
| PENTIMELE | Far South | 15/35 | 42.9% | 1994 | 2018 |
| LIDO COMUNALE PONTILE S | Far South | 14/35 | 40.0% | 2005 | 2024 |
| DELTA MESIMA | Tyrrhenian | 14/26 | 53.8% | 1999 | 2024 |
The figure is striking: 9 of the 10 most critical areas are in the same municipality (Reggio Calabria, ISTAT code 080063). The only external one is 'Delta Mesima' on the Tyrrhenian coast, the mouth of the Mesima river in the Rosarno-Gioia Tauro area (14 Poor years out of 26 recorded). The pattern of concentration in the Reggio area deserves a dedicated analysis.
3.4 The 'redeemed' areas: real improvements
Not everything is unchangeable: 172 Calabrian areas that have had at least one year with a Poor classification are today in the Excellent or Good class. These are improvement stories - typically linked to infrastructure works (new treatment plants, completion of sewer networks). The table shows examples of areas that had their last 'Poor' year many years ago and are clean today:
| Area | Zone | Total Poor years | Last Poor year | Last classified year | Years since 'redemption' |
|---|---|---|---|---|---|
| SCOGLIO PALOMBARO | Tyrrhenian | 1 | 1990 | 2024 | 34 |
| LE ROCCETTE | Tyrrhenian | 1 | 1990 | 2024 | 34 |
| MAGNA GRECIA | South Ionian | 1 | 1991 | 2024 | 33 |
| SPIAGGIA CLUB ALDIANA | Tyrrhenian | 1 | 1991 | 2024 | 33 |
| KM 146 STRADA PROVINCIALE | South Ionian | 1 | 1991 | 2024 | 33 |
| CAPITANERIA DI PORTO | South Ionian | 1 | 1991 | 2024 | 33 |
| GIARDINELLO | Tyrrhenian | 1 | 1991 | 2024 | 33 |
| BOSCHETTO | South Ionian | 1 | 1991 | 2024 | 33 |
| 1000 MT SUD TORRENTE BAGNI | Tyrrhenian | 1 | 1991 | 2024 | 33 |
| LIDO OTTAGONO | South Ionian | 2 | 1991 | 2024 | 33 |
These are positive examples: they show that water quality can be recovered when the causes (untreated discharges, undersized infrastructure) are addressed.
4. Reggio Calabria: the anomalous case
The metropolitan area of Reggio Calabria stands out clearly in the data: although it accounts for only 25 bathing areas out of a Calabrian total of 595, it contributes 9 of the 10 'worst' entries of the Hall of Shame. This chapter examines the possible causes.
4.1 Reggio Calabria zoom map
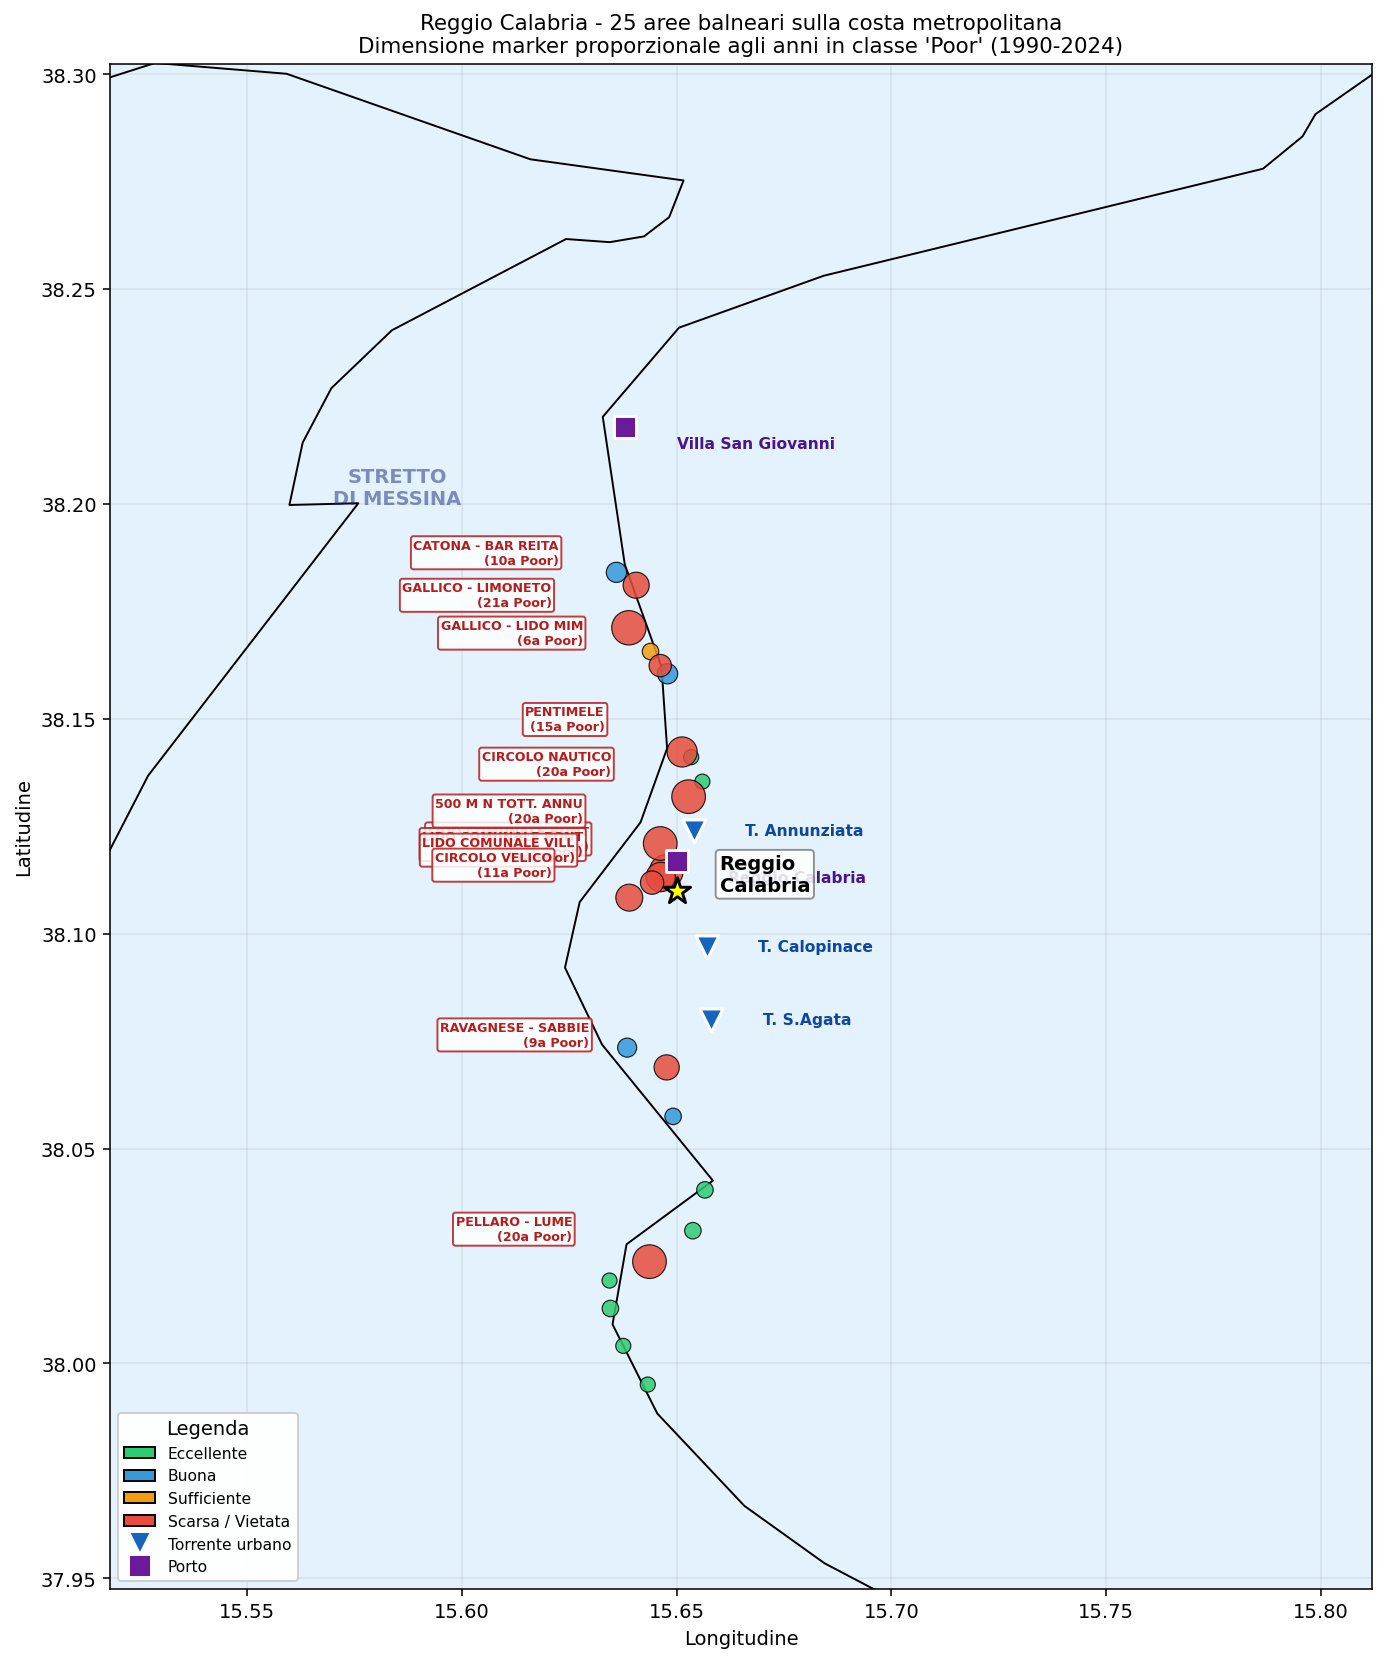
Figure 5 - Reggio Calabria, zoomed view of the metropolitan coast. 25 bathing areas distributed along the Strait of Messina. Marker size proportional to the number of years in the 'Poor' class over the 1990-2024 period. Light-blue triangles = urban streams (Annunziata, Calopinace, Sant'Agata). Purple squares = harbours.
What the map shows
The concentration of problem areas (large red circles) is evident in the central part, corresponding to the urban area proper, between the harbour of Reggio Calabria to the south and the Annunziata stream to the north. These are long-standing urban concentrations: Pellaro to the south (beyond the airport area), Catona-Bar Reitano to the north, and the whole central belt between the Calopinace and the Annunziata.
Three urban streams cross the built-up area of Reggio Calabria: the Annunziata (northern part), the Calopinace (central area, with its mouth near the Granillo stadium) and the Sant'Agata (southern part, near the Lido Comunale). All three are dry or nearly dry for much of the year, but during intense rainfall they discharge significant amounts of torrential water into the sea, which can carry debris, urban sediment and, in some cases, sewage spills (when the collectors overflow).
4.2 Temporal pattern: what the comparison with the Calabrian average says
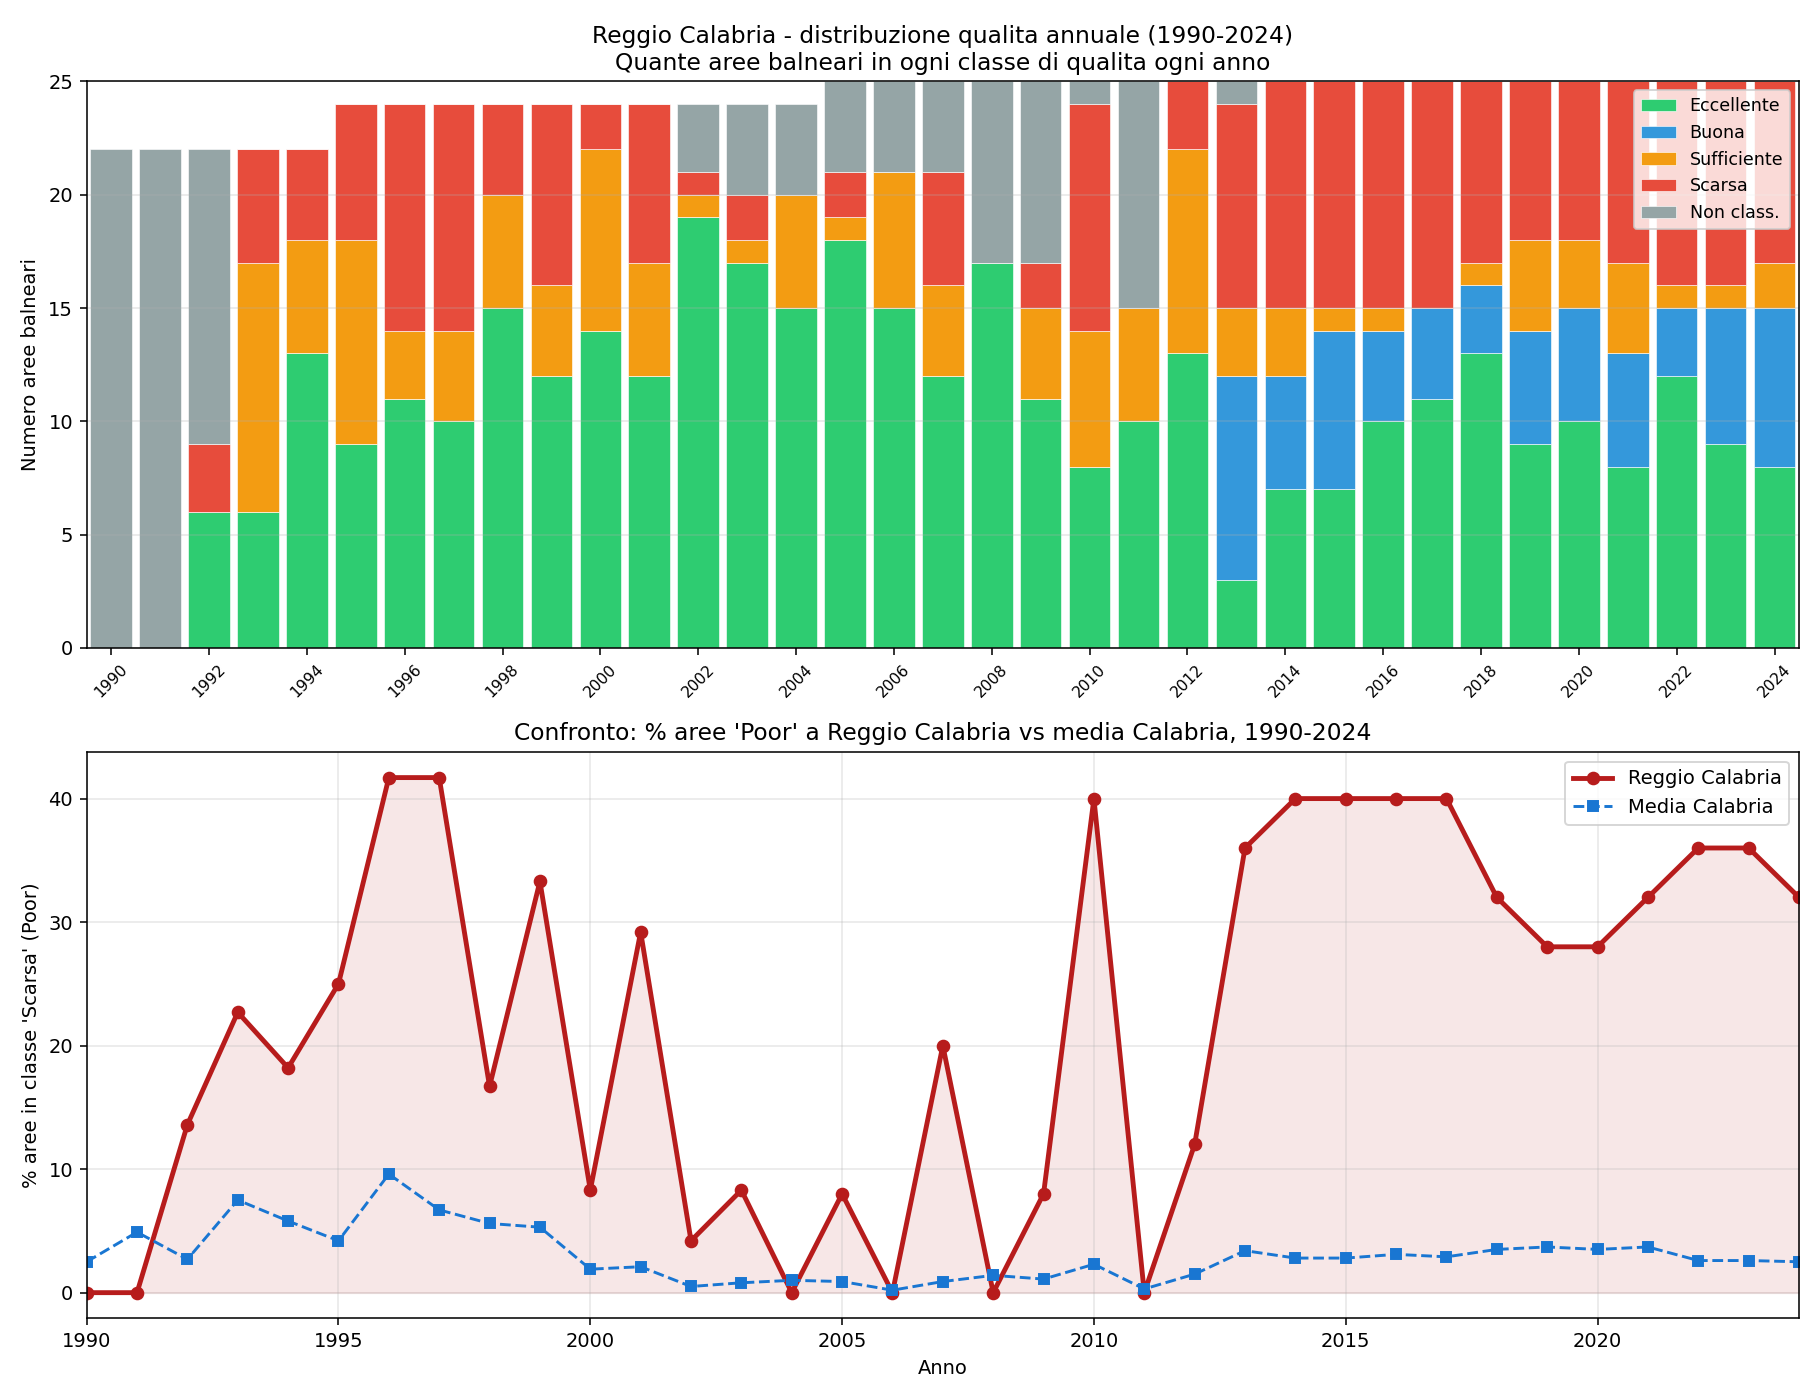
Figure 6 - Top: annual distribution of the 25 bathing areas of Reggio Calabria by quality class (1990-2024). Bottom: percentage of areas in the 'Poor' class in Reggio Calabria (red) compared with the Calabrian average (blue).
How to read it
The lower panel illustrates the problem visually: the red line for Reggio Calabria sits practically always 5-10 times above the Calabrian regional average (blue line). In particular:
- In the 1990s it fluctuated between 20% and 40% of Poor areas (a quarter of the areas banned for pollution!);
- Between 2003 and 2010 there was an improvement, with values dropping to 5-15%;
- From 2013 onwards it rose again steadily to 25-30%, where it still remains. That is 11 consecutive years with percentages among the highest of the whole historical series.
The jump in 2013 (a high number of 'not classified' areas in the upper heatmap) is probably linked to an administrative reorganisation: some areas were renamed or reallocated, and for a year or two they had no formal classification. But once that jump is absorbed, the pattern of structural problems returned exactly as before.
4.3 Top 10 critical areas of Reggio Calabria
| Area name | Poor years | % historical Poor | Exceedances 25-26 | Nearby stream | Distance |
|---|---|---|---|---|---|
| GALLICO - LIMONETO | 21/35 | 60.0% | 2 | Annunziata stream | 5.5 km |
| PELLARO - LUME | 20/35 | 57.1% | 1 | Sant'Agata stream | 6.4 km |
| 500 M N TOTT. ANNUNZIATA | 20/35 | 66.7% | 8 | Annunziata stream | 0.9 km |
| LIDO COMUNALE PONTILE N | 20/35 | 57.1% | 5 | Annunziata stream | 1.3 km |
| CIRCOLO NAUTICO | 20/35 | 57.1% | 2 | Annunziata stream | 0.9 km |
| PENTIMELE | 15/35 | 42.9% | 0 | Annunziata stream | 2.1 km |
| LIDO COMUNALE PONTILE S | 14/35 | 40.0% | 3 | Annunziata stream | 1.5 km |
| CIRCOLO VELICO | 11/35 | 36.7% | 2 | Calopinace stream | 2.4 km |
| CATONA - BAR REITANO | 10/35 | 28.6% | 1 | Annunziata stream | 6.5 km |
| RAVAGNESE - SABBIE BIANCHE | 9/35 | 25.7% | 4 | Sant'Agata stream | 1.7 km |
A spatial correlation can be seen: 7 of the 10 worst areas are within 2.5 km of the Annunziata stream (the most critical mouth of Reggio), the others near the Calopinace or the Sant'Agata. The 'Lido Comunale Pontile N' and 'Lido Comunale Pontile S' areas are practically at the mouth of the Annunziata.
4.4 Hypotheses on the causes
The causes of the persistence of the problem in Reggio Calabria are most likely multiple and interconnected. Without a detailed environmental investigation we can only list the most probable factors, in order of plausibility:
- Urban streams not sufficiently treated upstream. The catchments of the Annunziata, Calopinace and Sant'Agata cross the built-up area of Reggio Calabria (~180,000 inhabitants). Any sewer overflows, unauthorised discharges and urban runoff after intense rainfall end up directly in the Strait within minutes.
- Insufficient treatment-plant capacity. The southern section of Reggio (Pellaro, Bocale) has historically had treatment problems documented by regional investigations and European infringement procedures. The Gallico treatment plant (serving the northern part) has been the subject of works in recent years.
- High population density in heavily urbanised stretches. Metropolitan beaches such as Pentimele, Catona and Pellaro have a very high summer human load, with related direct discharges (showers, illegal connections, etc.).
- Complex currents of the Strait of Messina. The currents between the Tyrrhenian and the Ionian in the Strait are notoriously irregular (the famous tidal streams that reverse the flow every 6 hours). This can accumulate pollutants in a non-linear way, creating 'pockets' of stagnant water in some stretches.
- The presence of two nearby harbours (Reggio Calabria and Villa San Giovanni, with ferries) that generate continuous maritime traffic, with bilge discharges, fuel residues, etc.
All these causes add up - they are not alternatives. The only way to reduce the problem structurally would be coordinated investment in: (a) the modernisation of the treatment plants, (b) less permissive sewer-overflow systems, and (c) better management of urban stormwater.
5. Summary and links with other analyses
5.1 Answer to the initial question: Tyrrhenian or Ionian?
As regards bathing-water quality, the Ionian (the south in particular) is clearly better than the Tyrrhenian. The ranking of the four Calabrian zones is:
- South Ionian (Bovalino-Crotone): the best overall. 95% of area-years in historical Excellent. Recent exceedances practically nil.
- North Ionian (Crotone-Roseto): second. 90% historical Excellent, with a few localised problems around the mouth of the Crati (Sibari).
- Tyrrhenian (Praia-Scilla): third. 86% historical Excellent, with some recurring points near the mouths of important rivers (the Mesima above all).
- Far South (Reggio Calabria metropolitan area): the worst by far. 74% historical Excellent, with chronic problems concentrated in the urban area of Reggio Calabria.
5.2 Link with the analyses of sea temperature and mucilage
The previous study on sea surface temperature (SST) and mucilage preconditions had shown a consistent picture:
- The Tyrrhenian is the warmest (+2C since 1982) and shows the strongest mucilage preconditions, especially on the Amantea-Lamezia stretch. Yet its microbiological bathing-water quality remains good.
- The South Ionian is cooler and windier, with weak mucilage preconditions. This coincides with the best microbiological bathing-water quality.
The two dimensions (microbiological and environmental) are independent of each other in the way they are measured, but their correlation is interesting: the Tyrrhenian pays the price of rising temperature with mucilage, while the Ionian pays much less on both fronts. The Far South (Reggio Calabria) pays on everything: temperature, stratification and microbiological bathing-water quality.
For a tourist looking for clean and environmentally healthy waters, the Calabrian South Ionian remains the best choice. For the operators of the Tyrrhenian coast, the message is twofold: the microbiological bathing-water quality is generally good (except for a few specific points, typically at river mouths), but attention to seasonal mucilage is warranted.
5.3 Limitations of the study
The data used have some limitations that should be kept in mind when interpreting them:
- The Ministry portal exposes only the last two seasons (current and previous). For the historical weekly samples, specific ARPACAL sources would be needed, and these are not always public.
- The EEA dataset provides the annual classification, not the individual samples. So if in a given year an area had an isolated exceedance but still ended up Excellent, that is not visible from the EEA data.
- The Ministry coordinates are rectangular bounding boxes (the extent of the area), while the EEA ones are single points. When 'distance from the river mouth' is mentioned, it should be remembered that this is an approximate distance to the centroid.
- The hypotheses on the causes of the Reggio Calabria problems are plausible but not proven by this study. Additional environmental data (sewer discharges, rainfall events, bacterial species) would be needed to validate them.
- The assignment of areas to the four coastal zones uses simple geometric criteria (latitude/longitude). Some areas at the boundary between zones might be classified differently with more refined ecosystem-based criteria.
Despite these limitations, the picture that emerges is robust: the microbiological bathing-water quality of Calabria is excellent overall, with a localised but structural exception in the urban area of Reggio Calabria. Environmental policies should focus there.