Foreword
This document brings together, in a single discursive treatment, four strands of analysis on the sea of Calabria, all developed during 2026 in rapid succession as independent studies, and now recomposed coherently. It is intended for a unified reading, but each Part can be read on its own by anyone interested in a single aspect.
The four original strands were the following. The first study reconstructed the warming of the sea surface temperature (SST) on the Calabrian Tyrrhenian coast over the last 44 years of satellite observations, with particular attention to the Amantea-Lamezia stretch and its implications for the formation of summer mucilage. The second extended the analysis to the other three Calabrian coastal stretches (Far South, South Ionian, North Ionian), introducing two additional variables — marine wind and bathymetry — to understand why the Calabrian Ionian coast historically suffered less from mucilage than the Tyrrhenian. The third reconstructed 35 years of microbiological quality of the bathing waters along the entire Calabrian coast, combining the harmonised data of the European Environment Agency (1990-2024) with the individual samples of the Italian Ministry of Health portal (2025-2026 seasons). The fourth and most recent went deeper into the biogeochemical component of the sea (nutrients, observational satellite chlorophyll, primary productivity, pH/acidification, KD490 turbidity, salinity) to quantitatively test the popular hypothesis that the Calabrian Tyrrhenian coast is 'a sewer': six independent datasets, six converging proofs, a clear-cut answer.
The integration allows a coordinated reading that the four separate reports could not give. For example: understanding whether the warmest coasts are also the most problematic from the microbiological point of view (the answer is NOT the one intuitively expected — see Part IV), or why the metropolitan area of Reggio Calabria has such anomalous characteristics relative to the rest of the region, or again whether the chemistry of the Tyrrhenian waters really justifies the accusation of pollution (spoiler: no, clearly so). The guiding thread is the conviction that the quality of the Calabrian sea must be measured on at least three distinct but correlated dimensions: the physical-environmental one (temperature, wind, stratification, mucilage preconditions), the microbiological one (health safety for bathers) and the chemical-biological one (nutrients, phytoplankton biomass, turbidity, acidification), and that the policies of protection and tourism promotion must take all three into account.
A note of methodological honesty. This work does NOT replace the official assessments of the competent authorities — ARPACAL, the local health authorities, the Calabria Region, the Ministry of Health. It is an exercise in reworking public data, conducted to build a coherent general-interest picture. The four original technical reports (Relazione_SST_Mucillagini_Calabria, Relazione_Confronto_Coste_Calabresi, Relazione_Balneabilita_Calabria, Relazione_BGC_Mucillagini in the allegato_bgc/ subfolder) remain available as detailed appendices for those who wish to examine methods, formulas and precision figures. Every number presented in this document is derived from the automated Python scripts that produced the four reports; there is no 'manual' reworking that could introduce transcription errors.
Structure of the document
The document is organised into four parts, each with two or three chapters:
- PART I (Methods and sources) describes the datasets used — nine from the Copernicus Marine family (physics, wind, bathymetry, model and observational biogeochemistry), one from the world of wind climatologists (Global Wind Atlas), two from the world of public health (the Italian Ministry of Health + the European EEA) — and the technical processing pipeline (a central SQLite database, reproducible Python scripts).
- PART II (The Calabrian sea) is devoted to the physics and biogeochemistry of the sea: SST trend since 1982, marine heatwaves, wind, bathymetry, currents, and in Ch. 4.5 the modelled nutrients + the independent check with satellite chlorophyll, turbidity (KD490), pH and salinity. It answers the questions 'how has our sea changed physically in 44 years?' and 'does the chemistry of the Tyrrhenian waters confirm or refute the pollution hypothesis?'. The complete details of the biogeochemical component are in the appendix Relazione_BGC_Mucillagini.
- PART III (The coastal waters) is devoted to the microbiological quality of the bathing waters: 35 years of EEA history, the Tyrrhenian vs Ionian comparison, a deeper look at the persistent anomalies of the metropolitan area of Reggio Calabria. It answers the question 'how has the water quality changed for those who bathe in it?'.
- PART IV (Unified summary) proposes a coordinated reading of the three dimensions (physical-environmental, microbiological, biogeochemical), a map of the operational implications for tourism and land management, a discussion of the overall limitations and the possible future developments.
The datasets used, in summary
| Dataset | What it contains | Used in |
|---|---|---|
| Copernicus SST L4 REP | Sea surface temperature, ~1 km, 1982-today | The whole of Part II |
| Copernicus SST L4 NRT | Real-time variant of the same SST product | Monitoring system (Ch. 10) |
| Copernicus Wind L4 | Marine wind at 10 m, ~13 km, 2007-today | Ch. 4 (wind) |
| Copernicus Bathymetry MEDSEA_MULTIYEAR_PHY | Seabed depth, ~4.2 km | Ch. 4 (bathymetry) |
| Global Wind Atlas (DTU + World Bank) | Wind climatology at 250 m, independent check | Ch. 4 (verification) |
| Copernicus MedBFM bgc-nut | Nutrients NO3, PO4 from the biogeochemical model | Ch. 4.5 and 6.5 |
| Copernicus MedBFM bgc-bio | Net primary productivity (NPP) from the model | Ch. 4.5 and 6.5 |
| Copernicus MedBFM bgc-car | pH, total alkalinity, DIC (carbonates, acidification) | BGC appendix Ch. 9 |
| Copernicus Ocean Colour L4 1 km gap-free | OBSERVATIONAL satellite chlorophyll, multi-sensor | BGC appendix Ch. 8 |
| Copernicus Ocean Colour L3 1 km | KD490 (water turbidity), observational satellite | BGC appendix Ch. 10 |
| Copernicus Med-MFS physical | Surface salinity 0-10m, NEMO physical model | BGC appendix Ch. 11 |
| Ministry of Health - Bathing Waters Portal | 2025-2026 seasons, individual E.coli + enterococci samples | The whole of Part III |
| EEA Bathing Water Directive | Annual water-quality classification 1990-2024, all EU States | Ch. 7 (history) |
Unified glossary of acronyms and technical terms
To avoid the consultation of three separate glossaries, all the technical terms and acronyms used in the document are collected here. The list is organised into three sections: physical-oceanographic terms (used in Part II), ecological and mucilage-related terms (used in Parts II and III), and bathing-water and regulatory terms (used in Part III). Within each section the order is alphabetical to ease consultation.
Physical-oceanographic terms
| Term / Acronym | Meaning |
|---|---|
| Climate anomaly | The difference between an observed value and the mean computed over the reference period. Example: the 2024 summer anomaly is the summer 2024 SST minus the mean SST of the summers 1991-2020. It is measured in °C. |
| ASCAT / HSCAT | Microwave space-borne scatterometers on board the MetOp satellites (ESA/EUMETSAT) and HY-2 (China). They measure the roughness of the sea surface caused by the wind and infer its speed and direction. They are the main source of direct observation of marine wind. |
| Bathymetry | The depth of the seabed. Coasts with a wide continental shelf (e.g. the Gulf of Sant'Eufemia) have shallow seabeds for kilometres offshore; coasts with steep seabeds (much of the Calabrian Ionian) have depths over 500 m just a few km from the shore. Bathymetry conditions dynamic mixing. |
| Reference climatology | The mean computed over a reference period (here 1991-2020) used as the 'normal' against which to measure the deviations. Not to be confused with 'climate' in the general sense. |
| CMEMS / Copernicus Marine | Copernicus Marine Environment Monitoring Service - the European Union's marine monitoring service (Copernicus programme). It freely distributes satellite and model data on the sea. |
| Ionian and Tyrrhenian currents | The Atlantic Ionian Stream (AIS) is a cyclonic current that enters from the Sicily Channel and runs along the northern edge of the Ionian Sea, generally dynamic. The Tyrrhenian, by contrast, features semi-stationary anticyclonic eddies in its gulfs, typically less mobile. |
| Decade (in a trend) | A 10-year period. A trend expressed in '°C/decade' indicates how much the temperature rises every 10 years. Example: +0.5 °C/decade means +2 °C in 40 years. |
| doy (day of year) | The day of the year expressed as a progressive number from 1 (1 January) to 365 or 366. Example: 1 June = doy 152. |
| Calm window | A derived indicator: the number of consecutive periods (e.g. ≥10 days) in which the daily mean wind stays below a threshold (e.g. 5 m/s). More windows = more stratification conditions favourable to mucilage. |
| GWA - Global Wind Atlas | A global climatic wind atlas, produced by DTU Wind Energy (Technical University of Denmark) in partnership with the World Bank. It freely distributes high-resolution maps (~250 m) of the annual mean wind speed. Originally designed for wind farms, it is excellent for validating coarser-grid data. |
| JJA | The acronym for Jun-Jul-Aug; it denotes the three summer months (June-July-August), conventional in climatology. |
| L4 (Level 4) | A processing level of satellite data. The 'levels' run from L0 (raw data) to L4 (a regular daily map, gap-free, obtained by combining several sensors and interpolating the areas covered by clouds). L4 is used because it covers the whole map every day. |
| MHW (Marine Heat Wave) | A marine heatwave: under the international definition (Hobday et al. 2016), a period of at least 5 consecutive days with SST above the 90th percentile of the climatology, classified into 4 severity categories (I-IV). |
| NetCDF (.nc) | Network Common Data Form: a standard file format in climate research for storing large multidimensional arrays (time × latitude × longitude). |
| NRT (Near Real Time) | The version of the data published with a few hours' delay (useful for daily monitoring), statistically less reliable than the reprocessed product. |
| OSI SAF | Ocean and Sea Ice Satellite Application Facility - the European centre (a EUMETSAT consortium) that produces the SST data used. It guarantees decadal quality and consistency. |
| Percentile (90th) | The value below which 90% of the historical observations fall. Exceeding the 90th percentile means being among the 10% of warmest days relative to normal. |
| Reprocessed (REP) | The 'reprocessed' version of the satellite data: the same algorithms are applied consistently to the whole historical series (1982-today), so that comparisons between different years are statistically reliable. |
| σ (sigma) - standard deviation | A measure of the spread of the data around the mean. '±1σ' represents the band within which ~68% of the values fall in a normal distribution; '±2σ' the ~95%. |
| SST | Sea Surface Temperature - the temperature of the surface skin of the sea (the first ~1-2 mm of depth), measured by satellites using infrared or microwave sensors. It is the physical quantity at the centre of the whole study. |
| Thermal stratification | A sea configuration in which a warm, light surface layer floats on a colder, denser deep layer, without mixing. Typical of summer; it favours mucilage, surface oligotrophication and thermal shocks. |
| Thermocline | A transition layer (a few metres thick) in which the temperature drops sharply, passing from the warm surface waters to the cold deep ones. |
| Linear trend | The slope of the line that best approximates the historical series (linear regression). It indicates the mean rate of change. |
| Wind U10 / V10 | The horizontal components of the wind measured 10 metres above the sea surface. U10 = the east-west component, V10 = the north-south component. The magnitude is √(U10² + V10²) and represents the total speed. 10 m is the international marine-meteorological standard. |
| WMO | World Meteorological Organization. It defines the international standards, including the convention of using the 30-year period 1991-2020 as the 'reference period' for computing anomalies. |
| WRF / WAsP | Micro-scale atmospheric models used for the downscaling (spatial refinement) of wind from a coarse grid (~30 km of the ERA5 reanalysis) to a fine grid (~250 m). WRF = Weather Research and Forecasting; WAsP = Wind Atlas Analysis and Application Program, of DTU. |
Ecological and mucilage-related terms
| Term / Acronym | Meaning |
|---|---|
| ARPA Calabria | The Regional Environmental Protection Agency of Calabria. It conducts monitoring of coastal waters, including the Ostreopsis surveillance. |
| EPS | Extracellular Polysaccharides - complex sugars released by phytoplankton under stress. The chemical basis of mucilage. |
| Gorgonian | Branching cnidarians (relatives of corals) that live on submerged rock walls. Sensitive indicators of thermal stress. Species typical of the Calabrian Tyrrhenian: Paramuricea clavata (red), Eunicella cavolini (yellow). |
| HAB (Harmful Algal Bloom) | An explosive proliferation of a phytoplankton species that produces toxins or harmful effects on the environment and/or on humans. |
| ISPRA | The Italian Higher Institute for Environmental Protection and Research. The national reference body for Italian environmental monitoring. |
| Mucilage | A gelatinous mass of exopolysaccharides produced by phytoplankton under stress. It appears as pelagic filaments, floating yellow-brown aggregates, persistent foam along the shoreline, decaying gelatinous deposits, or brown underwater 'carpets' that smother posidonia and gorgonians. |
| Oligotrophication | A state of low nutrient content (nitrogen, phosphorus) of a water mass. Summer stratification isolates the surface layer and makes it oligotrophic, stressing the phytoplankton. |
| Ostreopsis ovata | A benthic dinoflagellate microalga that produces palytoxin; during summer blooms in Italian seas it can cause respiratory irritation in bathers (a 'toxic aerosol' effect). |
| Posidonia oceanica | A marine plant (not an alga) endemic to the Mediterranean; it forms underwater meadows fundamental to the coastal ecosystem. A species protected at EU level. |
| T-MEDNet | A thermal and biological monitoring network for the Mediterranean, coordinated by the Institut de Ciències del Mar (Barcelona). It documents the effects of warming on the benthic fauna. |
| TEP (Transparent Exopolymer Particles) | Transparent gelatinous particles formed by the aggregation of EPS in water. They are the microscopic 'building block' of mucilage. |
| Tropicalisation | The phenomenon by which species typical of warmer seas (tropical, subtropical) expand their range towards the Mediterranean, replacing or joining native species. Accelerated by the warming of the seas. |
Bathing-water and regulatory terms
| Term / Acronym | Meaning |
|---|---|
| Bathing water | Under Italian law (Legislative Decree 116/2008), any stretch of coastal water, lake, river or estuary designated by local authorities for bathing, where a large number of bathers is expected. Areas that are NOT designated (river mouths, harbours, military areas, discharge points) are EXCLUDED a priori - they are neither 'bathing' nor 'non-bathing' waters. |
| ASL | Azienda Sanitaria Locale - the local health authority that carries out the mandatory sampling (one before the season + at least three during it, every 4 weeks). |
| BWD | Bathing Water Directive - European Directive 2006/7/EC on the quality of bathing water. Transposed in Italy by Legislative Decree 116/2008. |
| cfu (colony forming units) | The measure used in microbiology to count viable bacteria. cfu/100ml = the number of bacterial colonies per 100 ml of water. |
| BWD quality classes | The four final classes into which each area is classified at the end of the season: 1 = Excellent, 2 = Good, 3 = Sufficient, 4 = Poor. The classification takes into account the last four years of monitoring. Areas in the 'Poor' class MUST be closed to bathing for the following season. |
| Legislative Decree 116/2008 | The Italian decree that transposes the BWD. It defines what is (and what is NOT) a bathing water, the regulatory parameters and the sampling procedures. |
| EEA | European Environment Agency. It publishes annually the harmonised dataset of the BWD classifications of all Member States (1990-today). |
| E. coli (Escherichia coli) | A bacterium found in the intestine of mammals (humans included). Its presence in water indicates faecal contamination, and therefore the possible presence of more dangerous pathogens. Regulatory limit for bathing-water quality: 500 cfu/100ml. |
| Intestinal enterococci | A bacterial family that is an indicator of faecal contamination, more resistant than E. coli in sea water. A complementary indicator. Regulatory limit: 200 cfu/100ml. |
| River mouth | The point where a river flows into the sea. By law the stretch of sea in front of a river mouth is EXCLUDED from bathing waters, because it is considered structurally unsafe (untreated freshwater inflow). The adjacent stretches of sea can, however, be indirectly affected, especially after rainfall. |
| ISTAT | The Italian National Institute of Statistics. It provides the municipal codes used in the official datasets (six-digit code). |
| Commercial harbour | Also EXCLUDED from bathing waters (collision risk, oils, logistics activity). The adjacent stretches can nonetheless be affected by residual pollution. |
| Bathing water profile | A descriptive document (PDF) produced and updated by the Regions that characterises each bathing area: physical description, potential contamination sources, management. Available online on the Ministry's Bathing Waters Portal. |
| Exceedance (single sample) | When a single sample exceeds the regulatory limits for E. coli or enterococci. It does not immediately trigger a ban, but it triggers a re-sampling and contributes to the end-of-season classification. |
Biogeochemical terms (summary — details in the BGC appendix)
The chemical-biological terms that appear in Ch. 4.5 (BGC) have a concise definition here. The complete definitions, with units of measurement and reasons for analysis, are in the extended glossary of the technical appendix Relazione_BGC_Mucillagini.docx.
| Term / Abbreviation | Meaning and reason for analysis |
|---|---|
| NO₃ (nitrate) | The most oxidised form of nitrogen dissolved in the sea. An essential nutrient for phytoplankton. High concentrations indicate human inputs (sewage, agricultural). Unit: μM (micromoles/litre). |
| PO₄ (phosphate) | The anion of phosphoric acid. An essential nutrient for phytoplankton, present in domestic discharges (soaps, detergents). Limiting in the Mediterranean. Unit: μM. |
| N:P ratio | The molar nitrate/phosphate ratio. An indicator of chemical imbalance for phytoplankton. The optimal Redfield ratio is 16:1 — values well above indicate strong phosphorus limitation (typical of the Mediterranean). |
| NPP (Net Primary Production) | How much carbon (= new biomass) the phytoplankton fixes via photosynthesis each day per cubic metre of water. A proxy of biological productivity. Unit: mgC/m³/day. |
| CHL (Chlorophyll-a) | A photosynthetic pigment. A direct proxy of phytoplankton biomass. Measured by satellite (ocean colour). Unit: mg/m³. |
| KD490 | The light attenuation coefficient at 490 nm. A satellite proxy of water TURBIDITY: high values = turbid water (more particulates/algae/discharges). Unit: m⁻¹. |
| Total alkalinity (TALK) | The capacity of water to neutralise acids (buffering capacity). It measures the concentration of carbonates and bicarbonates. Unit: mol/m³. |
| Marine acidification | The progressive lowering of marine pH due to the absorption of anthropogenic atmospheric CO₂. A global phenomenon, ~0.01-0.02 pH units/decade. |
| Salinity (PSU) | The quantity of dissolved salts, measured in Practical Salinity Units. Typical Mediterranean values: 37-39 PSU. Fresher water = less salty. |
| MedBFM (Mediterranean BioGeoChemical Flux Model) | A Copernicus numerical model that simulates the biogeochemical cycles of the Mediterranean. Developed by OGS Trieste. The source of our data on nutrients, NPP, pH. |
| EPS (Extracellular Polysaccharides) | Polysaccharides released by phytoplankton under stress. The biological 'building blocks' of mucilage. |
| TEP (Transparent Exopolymer Particles) | Transparent gelatinous particles formed by the aggregation of EPS. The precursor aggregation state of visible mucilage. |
| Ocean Colour (satellite observations) | Satellite measurements of the colour of the sea in the visible wavelengths. From these, chlorophyll and turbidity are derived. Sensors: MODIS-Aqua, Sentinel-3 OLCI, VIIRS. |
PART I
Methods and sources
1. Data sources and methodology
1.1 How sea temperature is measured from space
Sea surface temperature (SST) can be measured with three different families of instruments, each with its strengths and limits. Oceanographic buoys and sensors on board ships provide point measurements but sparse and expensive ones. Infrared sensors on board satellites give high spatial resolution, but are blocked by clouds. Microwave sensors, also satellite-based, manage to 'see' through clouds, but have a coarser spatial resolution.
None of the three solutions on its own produces a complete, continuous and uniform map. For this reason the European centres intelligently combine several satellite sources (the MetOp, NOAA, Suomi-NPP, Meteosat Second Generation missions), producing an integrated product called 'Level 4' (L4). An L4 datum is a daily map of the entire Mediterranean, gap-free (the system statistically interpolates the areas covered by clouds using the data of nearby days and of complementary satellites) and with a spatial resolution of about 1 km × 1 km. It is the product we will use throughout Part II.
To obtain a historical series usable for climate analyses, the L4 algorithms must be applied consistently to the whole satellite history; this product is called 'reprocessed' (REP). Without the reprocessing, comparing the temperature of 1985 with that of 2024 would be like comparing a measurement made with a thermometer of one brand with one made with a thermometer of another brand: the data would not be directly comparable.
1.2 The Copernicus datasets used
Three Copernicus Marine products form the basis of Part II. The first provides the sea temperature, the second the wind over the sea surface, the third the bathymetry (seabed depth).
For the sea temperature the following dataset was used:
SST_MED_SST_L4_REP_OBSERVATIONS_010_021
This is the official Copernicus Marine product for Mediterranean SST, Level 4, reprocessed version. Its essential technical characteristics are these:
| Characteristic | Value |
|---|---|
| Geographical coverage | The whole Mediterranean Sea |
| Period covered | From January 1982 to about 6 months before the current date |
| Spatial resolution | ~1 km (0.01° in latitude and longitude) |
| Temporal resolution | 1 map per day (daily mean datum) |
| Variable measured | Temperature of the surface skin (in Kelvin) |
| Sensors used | A multi-satellite combination (NOAA AVHRR, MetOp, Sentinel, MSG) |
| Algorithm | OSI SAF L4 with adaptive gap-filling based on neural networks |
| Stated accuracy | Typical error ~0.2-0.3 °C relative to in situ measurements |
| Availability | Free upon registration at marine.copernicus.eu |
For the marine wind the hourly reprocessed product was used:
cmems_obs-wind_glo_phy_my_l4_0.125deg_PT1H
This is the 'Global Ocean Hourly Reprocessed Sea Surface Wind and Stress', which provides the wind components U10 and V10 (the east-west and north-south components, measured 10 metres above the sea surface, which is the international marine-meteorological standard) with a spatial resolution of ~13 km and an hourly cadence. To reduce the data volume, the 24 daily hourly measurements were aggregated into a single daily mean. The dataset is available from January 2007. Source: a combination of scatterometer observations (ASCAT, HSCAT) with the ECMWF atmospheric reanalysis.
For the bathymetry (seabed depth) the static variable deptho of the product MEDSEA_MULTIYEAR_PHY_006_004 was used, with a spatial resolution of ~4.2 km. It is a datum that does not change over time (the depth of the Calabrian seabeds is stable on a scale of years) and is downloaded only once.
1.3 The key difference: reprocessed vs near-real-time data
An important technical distinction with practical implications is the one between 'reprocessed' (REP) and 'near-real-time' (NRT) data. They are two variants of the same SST product, produced by Copernicus for different uses:
| Characteristic | REP (reprocessed) | NRT (near-real-time) |
|---|---|---|
| Publication timing | Published in six-monthly blocks, with a lag of ~4-5 months | Published every day, with a lag of ~24-48 hours |
| Algorithms | Applied to the whole 1982-today series uniformly | Algorithms calibrated on the latest available version |
| Statistical stability | Maximum: the whole series is consistent | Good but subject to small adjustments when the REP is published |
| Typical use | Climate studies, historical analyses, trend computation | Operational monitoring, alerts, daily dashboards |
| Volume for the Tyrrhenian analysis | ~60 MB for the Praia-Scilla box, 1982-2024 | ~50 KB per day for the same box |
| Used in this analysis | Yes - for the whole historical picture in Part II | Proposed for the real-time alert system (Ch. 10) |
The operational choice is therefore to use REP to build, once and for all, the 'climate snapshot' (the reference climatology + the 90th-percentile thresholds for each day of the year) and then to compare the daily NRT data against these pre-computed thresholds. When Copernicus publishes new blocks of REP (which it does roughly every 6 months), the historical archive can be updated: a non-urgent operation, because it serves only to extend the long-term charts.
1.4 Global Wind Atlas: an independent check of the wind
To be sure that the wind pattern observed on the four Calabrian coasts is not an artefact of the Copernicus dataset, a check was carried out with a completely independent source: the Global Wind Atlas (GWA), produced by DTU Wind Energy (Technical University of Denmark) in collaboration with the World Bank. The GWA provides high spatial-resolution climatologies (250 m) based on micro-scale downscaling (WAsP/WRF models) of the ERA5 atmospheric reanalysis. It was originally created for the sizing of wind farms, but it is excellent for validating coarser-grid data.
The GeoTIFF file for Italy at a height of 10 m (47 MB) was downloaded via the GWA API. For each of the four coastal boxes the spatial mean of the pixels was computed and compared with the corresponding mean of the Copernicus data. The values agree to within 0.2-0.3 m/s, a difference fully within the order of the uncertainty between different products at a 10 m height. The relative pattern (South Ionian > North Ionian ≈ Far South > Tyrrhenian) is confirmed. This means that the Copernicus figures we will use are not an artefact: the wind regime of the four coasts is genuinely different and independently documented.
1.5 The Ministry of Health's Bathing Waters Portal
The Bathing Waters Portal of the Italian Ministry of Health (www.portaleacque.salute.gov.it) makes the data of the last two bathing seasons (current + previous) available for consultation for all Italian bathing waters. For each area one can see the individual samples collected by the local health authorities with the date, the measured values of E. coli and intestinal enterococci, and whether they exceeded the regulatory limits (respectively 500 cfu/100ml and 200 cfu/100ml for standard coastal waters).
The portal does not offer an officially documented API, but the calls used internally by the interactive map were reconstructed by analysing the JavaScript code of the page. Three AJAX endpoints were identified: the first (ricercaComuni) searches municipalities by name and returns their ISTAT codes in JSON format; the second (ricercaAreeBalneazione) lists the bathing areas of a given municipality; the third (datiArea) returns the registry data of the area plus all the analyses of the current season and of the previous-season history.
The ingestion script (acque_calabria.py) enumerates all 351 Calabrian municipalities through an algorithm of increasing prefixes that gets around the limit of 10 results per query, identifies the coastal ones (103) and downloads, for each of their bathing areas, the complete list of samples. In total, 4,420 individual microbiological analyses from the 2025 and 2026 seasons were loaded into the local SQLite database.
1.6 EEA Bathing Water Directive (1990-2024)
The European Environment Agency publishes every year the harmonised dataset of the annual BWD classifications of all 27 Member States (over 22,000 European bathing areas), distributed as a single Excel file of about 38 MB. The dataset covers the historical series 1990-2024 — 35 years — and provides, for each area and for each year, the final classification in four categories: 1 Excellent, 2 Good, 3 Sufficient, 4 Poor. Areas in the 'Poor' class must be closed to bathing for the following season.
Unlike the Italian portal, the EEA does not report the individual samples, but a single row per area per year with the summary classification. It is therefore the best way to reconstruct 35 years of history of a single beach: information that the Italian portal simply does not possess.
The mapping between the code used by the Ministry (e.g. '1864' for BAR VITTORIA at Falerna) and the EEA identifier (e.g. 'IT018079047004') was reconstructed through the name of the bathing-water profile PDF, which follows the EEA standard. The Italian EEA code is structured like this: 'IT' (country) + '018' (region code: 018 = Calabria) + '079047' (the municipality's ISTAT code: 079047 = Falerna) + '004' (the progressive number of the area within the municipality). 21,564 rows (1990-2024) were loaded for 652 historical Calabrian areas.
1.7 Climatological reference (1991-2020)
All the anomalies and deviations presented are computed relative to the mean of the 30-year period 1991-2020. This choice follows the convention of the World Meteorological Organization (WMO) which, since 2021, recommends the use of this period as the reference 'climate normal'. It is important to stress one point: the 1991-2020 period already includes a significant portion of the ongoing global warming. Comparing against this 'normal' therefore means measuring how far we are above an already warm baseline. The real anomalies relative to the pre-industrial climate, or even just to the 1980s, would be significantly larger.
2. Processing pipeline and database
The whole process is automated in a small set of Python scripts, all reproducible. The raw data are in NetCDF format (for the satellite products) or Excel (for the EEA), while the results are persisted in a single SQLite database (acque_calabria.db) that acts as a central hub for all the analyses and visualisations of Part III. All the datasets are downloaded only once (at the first run of the script that uses them) and saved in a local cache, so that subsequent reprocessing is practically instantaneous.
2.1 The scripts in cascade
Eight chained Python scripts produce everything presented in this document, from the raw data to the final Word reports:
| Script | Function |
|---|---|
| sst_calabria.py | Downloads the Copernicus SST data for two boxes (Tyrrhenian + Amantea-Lamezia), produces annual and seasonal trends and anomaly maps. The basis of Part II ch. 3 and 5. |
| confronto_coste.py | Extends the analysis to the four Calabrian coastal zones. Downloads SST + wind + bathymetry, computes the multifactor mucilage-precondition index. The basis of Part II ch. 4. |
| mucillagini_analysis.py | Computes the precursor indicators (May SST, doy 22°C, critical window) for the Amantea-Lamezia stretch. The basis of Part III ch. 6. |
| acque_calabria.py | Reverse engineering of the Ministry of Health portal API, ingestion into SQLite of all the coastal municipalities of Calabria and their samples. The basis of Part III ch. 7-8. |
| acque_eea.py | Loads the EEA Excel dataset, maps the European identifiers to the Italian codes, populates the qualita_eea table with 35 years of history. |
| analisi_balneabilita_coste.py | Aggregates the bathing-water data for the four coastal zones, produces comparative statistics, historical heatmaps, the Hall of Shame and Redemption tables. |
| analisi_balneabilita_dettaglio.py | A deeper look: a map of Calabria with river mouths/harbours, the Reggio Calabria zoom, an analysis of the temporal pattern of the metropolitan area. |
| genera_relazione_master.py (this script) | Integrates into a single Word document all the results of the previous reports, maintaining the discursive style of the original. |
2.2 The SQLite database acque_calabria.db
The central database contains four main tables (plus one for the ingestion log). The structure was designed to be normalised but at the same time easily queryable with simple SQL queries, even by those who are not familiar with complex relational databases.
| Table | Content |
|---|---|
| comuni | 351 municipalities of Calabria with registry data (ISTAT code, name, province, province abbreviation, region, geographical bounding box) and an is_costiero flag set to 1 if the municipality has at least one bathing area. |
| aree_balneazione | 552 bathing areas (of which 519 active today) with latitude/longitude coordinates, current classification, applicable regulatory limits, profile-PDF URL, EEA identifier derived from the URL. |
| analisi | 4,420 individual samples of the 2025-2026 seasons with date, measured values of E.coli and enterococci (in cfu/100ml), over-limit flag, type of analysis. A UNIQUE index on area+date to avoid duplicates. |
| qualita_eea | 21,564 historical EEA rows 1990-2024 with annual classification, municipality ISTAT code derived from the identifier, point coordinates, profile URL. A UNIQUE index on identifier+season. |
| interdizioni | 30 active temporary bans with a description of the event, the management measure, the ordinance reference, the start date and any end date. |
The database is accessible with any SQLite client (DB Browser for SQLite, SQLite Studio, the 'sqlite3' command from a terminal) and can be queried with standard SQL. All the statistics presented in the rest of the document can be derived with direct SELECTs on the tables listed, guaranteeing complete transparency and immediate reproducibility.
PART II
The Calabrian sea
3. Marine warming along the four Calabrian coasts
44 years of daily satellite data (1982-2025) make it possible to reconstruct how the sea temperature has changed along the entire Calabrian coast. The study developed in two stages: initially focused on the Tyrrhenian alone (with a particular focus on the Amantea-Lamezia stretch for its tourism relevance), then extended to the other three coastal stretches to answer the question 'does the Ionian warm less?'. The chapter is organised following this same progression: first the Tyrrhenian picture in detail, then the comparison with the other three coasts, then a summary.
3.1 The Tyrrhenian picture: the key figures
The analysis of the 44 years of satellite observations returns a clear picture: the sea in front of the Tyrrhenian coast of Calabria has warmed significantly and in a statistically robust way, with a marked acceleration in the last decade. The following table summarises the main indicators both for the whole Tyrrhenian coast (Praia a Mare → Scilla, over 180 km) and for the restricted focus on the Amantea-Lamezia stretch.
| Indicator | Tyrrhenian coast (Praia → Scilla) | Amantea-Lamezia focus |
|---|---|---|
| Mean annual SST trend | +0.30 °C / decade | +0.31 °C / decade |
| Mean summer SST trend (JJA) | +0.52 °C / decade | +0.53 °C / decade |
| Mean annual SST 1982 | 19.65 °C | 19.64 °C |
| Mean annual SST 2024 (record) | 21.33 °C | 21.33 °C |
| Summer anomaly 2024 (record) | +1.97 °C | +2.00 °C |
| Summer anomaly 2025 | +1.79 °C | +1.77 °C |
| Coldest year (summer anomaly) | 1984 (-1.78 °C) | 1984 (-1.86 °C) |
| Overall change 1982 vs 2024 | +1.68 °C (annual) | +1.69 °C (annual) |
Two operational observations emerge straight away from the table:
- Summer warms almost twice as fast as the annual mean: 0.52 °C/decade against 0.30 °C/decade. This is consistent with the scientific literature on the Mediterranean, identified as one of the main global climate 'hotspots': summer stratification concentrates the warming in the surface layer, whereas in winter the mixing attenuates the phenomenon.
- The two study areas (the whole Tyrrhenian and the Amantea-Lamezia focus) are practically identical in trend and mean values. This means that the warming is a regional phenomenon, not linked to local specifics (currents, point discharges, etc.). The Amantea-Lamezia stretch behaves exactly like the Calabrian Tyrrhenian average.
3.2 Long-term trend: 44 years of observations
Figures 3.1 and 3.2 show the year-by-year evolution of the mean annual SST (blue line) and of the mean summer SST (red line, June-August), together with the linear regression line that quantifies the tendency. The lower panel of each figure reports the summer anomaly of each year relative to the 1991-2020 climatology: red bars for years warmer than normal, blue bars for colder years.
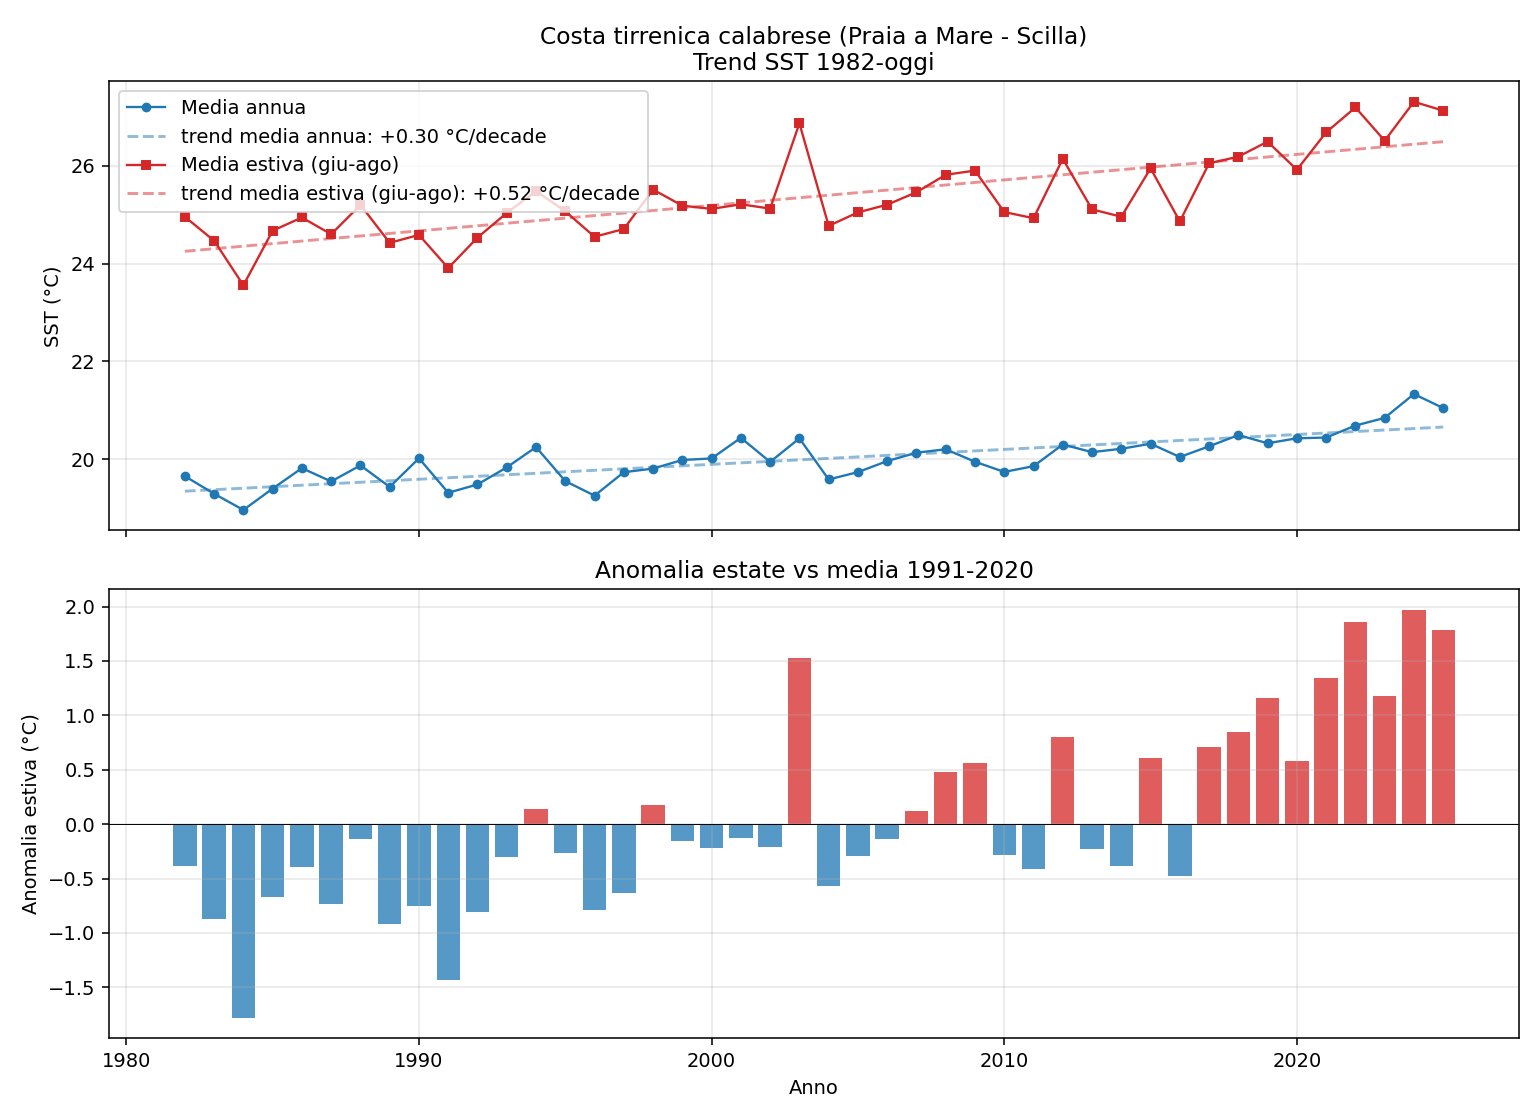
Figure 3.1 — Calabrian Tyrrhenian coast (Praia a Mare → Scilla). Top: mean annual SST (blue) and mean summer JJA SST (red), 1982-2025, with dashed linear-regression lines. Bottom: summer anomaly year by year relative to the 1991-2020 mean. The red bars represent summers warmer than normal, the blue ones colder.
How to read the chart
The upper panel tells how warm the sea is each year, separating the annual mean and the summer mean. The dashed lines are the 'trends': the mean rate at which the temperature rises. The blue line (annual mean) rises by 0.30 °C every 10 years, the red line (summer mean) rises by 0.52 °C every 10 years — almost double the growth. Over 44 years, this means that summers are on average about 2.3 °C warmer than at the start of the series.
The lower panel — the bars — helps to see clearly when the warming becomes the rule and not the exception. Three distinct phases are visible:
- 1982-1997 (the 'cold' phase): blue bars predominate (summers below average), with two striking negative peaks: 1984 (-1.78 °C) and 1991 (-1.43 °C);
- 1998-2014 (transition): the bars oscillate around zero. A famous exception: the summer of 2003 (+1.53 °C), the year of the great European heatwave that caused thousands of deaths in France and Italy;
- 2015-2025 (the 'persistent warm' phase): practically all the bars are red, with increasing anomalies. The last 5 summers all have an anomaly above +1 °C — a condition never observed before in the data. 2024 marks the absolute record of the series (+1.97 °C on the Tyrrhenian coast, +2.00 °C in the Amantea-Lamezia focus).
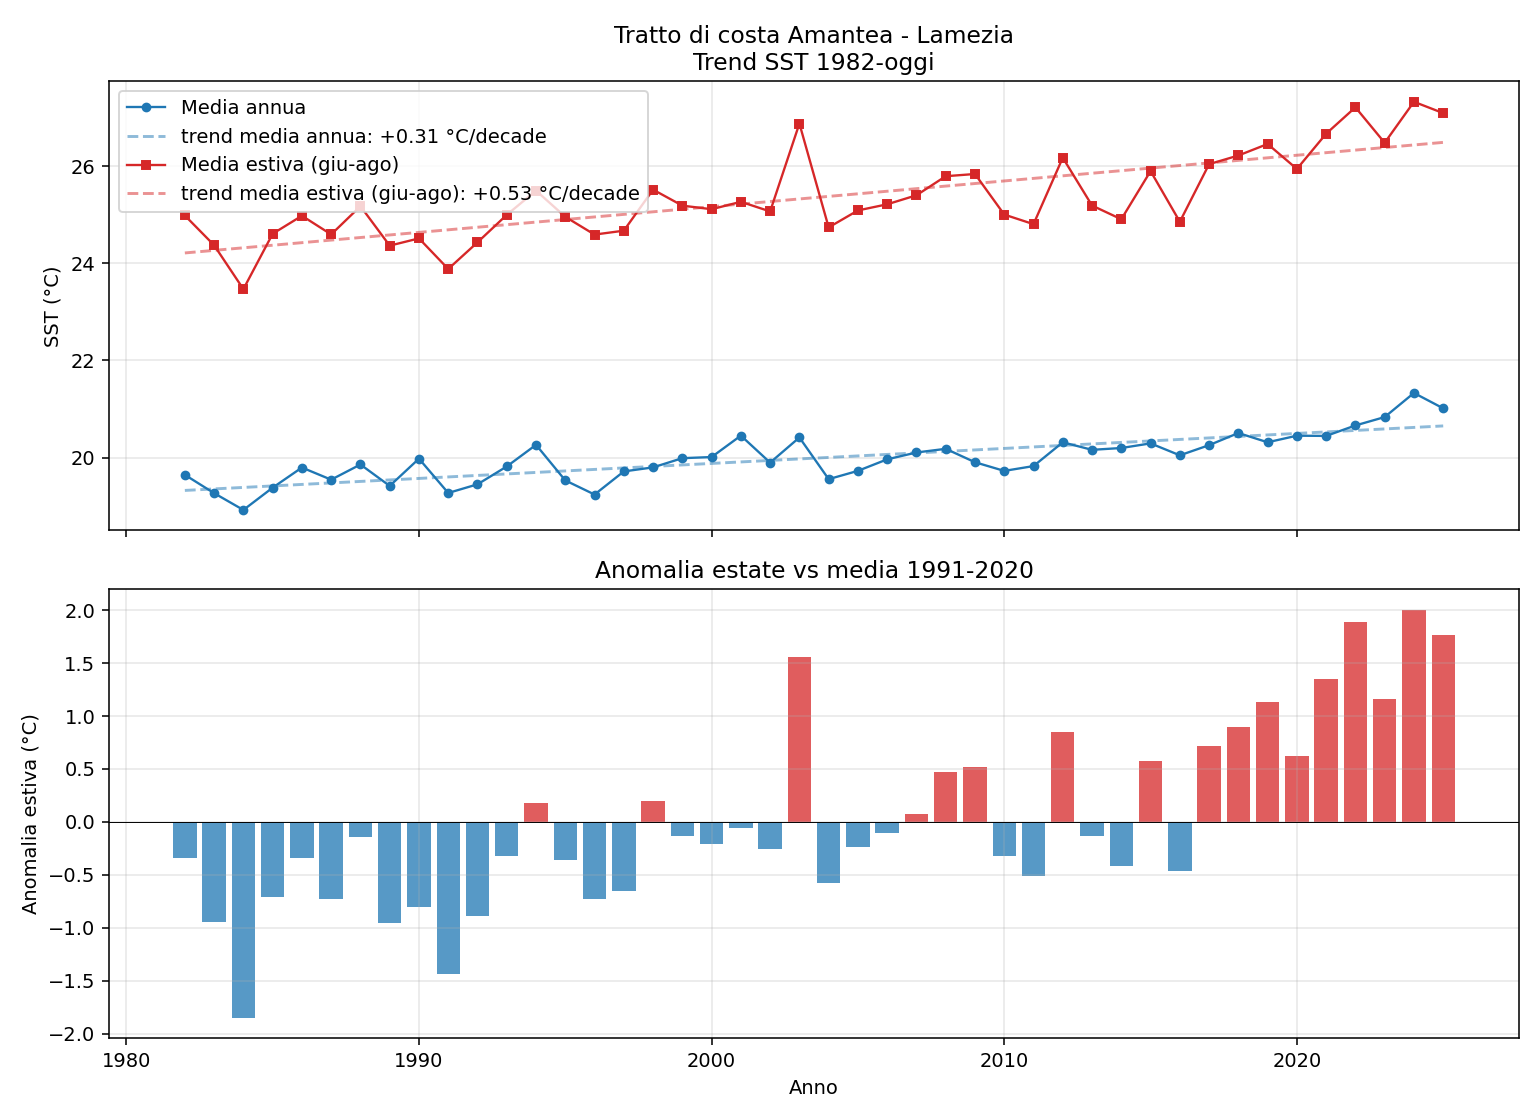
Figure 3.2 — The same chart as Figure 3.1 but referring only to the Amantea-Lamezia stretch (focus area). The values and trends are practically identical to the regional ones, a sign that the warming is a widespread and not a local phenomenon.
3.3 Seasonal comparison: how the summer has changed
Knowing that the summer mean has risen by 2 °C says a lot in climatic terms, but it does not tell how that change is distributed within the summer. Figure 3.3 shows the 44 summer curves (1 June - 30 September) overlaid: each line is one year, coloured according to a purple → yellow colour gradient (purple = older years, yellow = recent years). The 5 most recent curves are highlighted in bold.
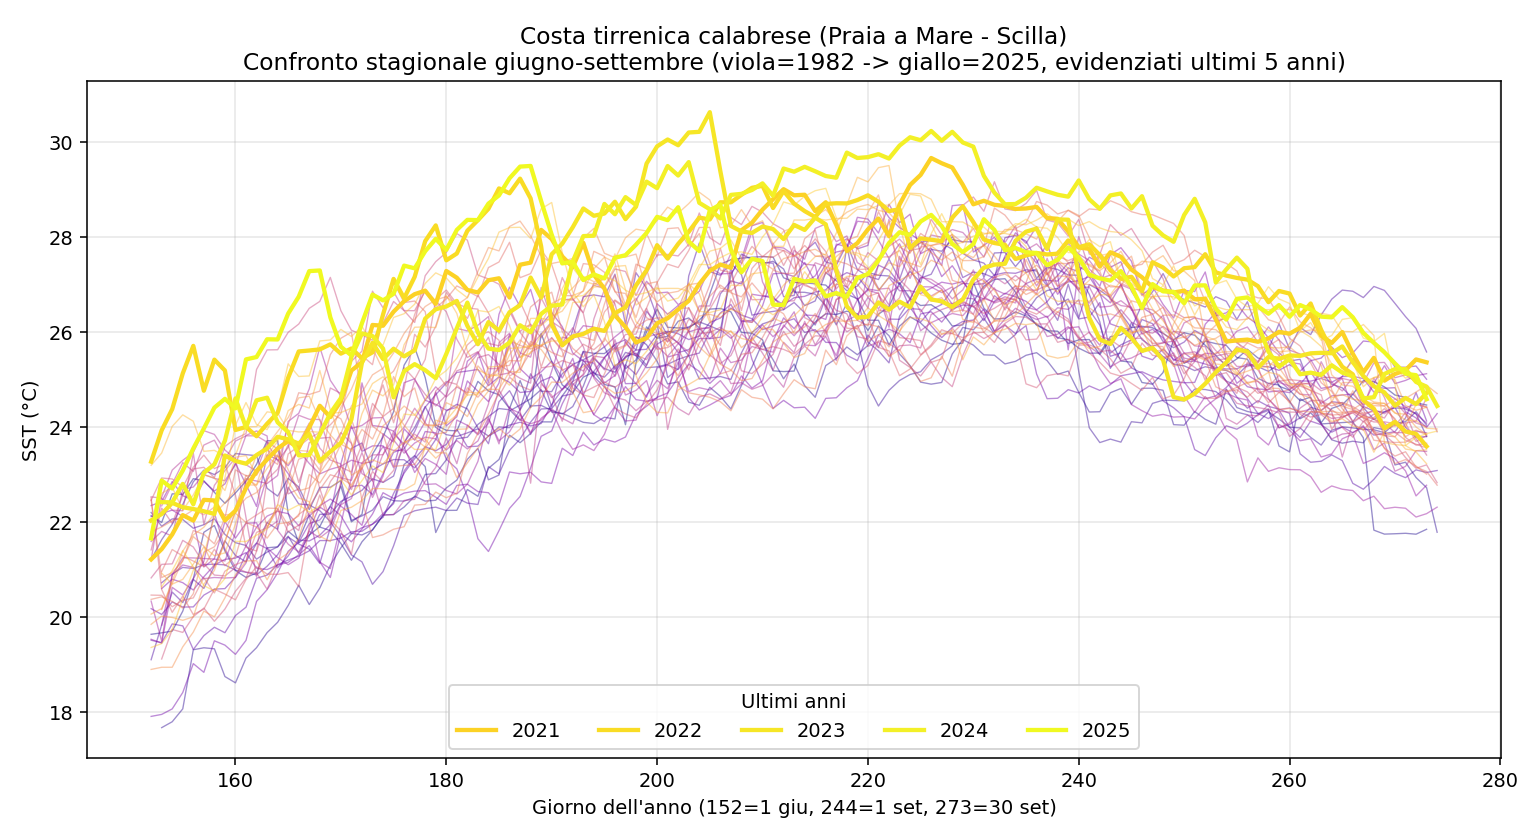
Figure 3.3 — Calabrian Tyrrhenian coast: comparison of the June-September summer curves for each year from 1982 to 2025. The colour gradient runs from purple (older years) to yellow (more recent years). The last 5 seasons are highlighted with greater thickness.
How to read the chart
The main message of this chart is visual even before it is numerical: the yellow curves (recent years) lie systematically above the purple curves (old years). This means that no day of the summer of the recent years is 'like a day of the summer of the 1980s'.
Three operational details:
- The summer peak: in the past it was typically in the first half of August, with SST around 25-26 °C. Today the peak is in mid-to-late August, around 27 °C, with spikes above 28 °C on isolated days.
- The end-of-summer tail: in the past the sea began to cool rapidly from September. Today the SST stays above 26 °C until mid-September and above 24 °C until almost October. The 'warm sea' season has lengthened by 3-4 weeks.
- The start of summer: June too warms earlier. The SST today reaches 23 °C as early as the first days of June, whereas up to the 1990s this threshold was typically reached around 20-25 June.
3.4 Spatial distribution: where does Calabria warm the most?
Figures 3.4 and 3.5 are anomaly maps. They compare the mean temperature of the recent decade (2015-2024) with the 1991-2020 climatology, showing how much warmer the sea is at each point of the coast. Dark red indicates positive anomalies (warmer sea); white would indicate no change; blue — absent from our maps — would indicate cooling.
The maps are deliberately drawn over the whole of Calabria, with the coastline, the provincial capitals (in yellow: Cosenza, Catanzaro, Reggio Calabria, Crotone, Vibo Valentia, Lamezia Terme) and the main Tyrrhenian coastal towns (in white). The yellow box highlights the Amantea-Lamezia stretch on which the detailed analysis was focused. The blue dashed box (in Figure 3.4) highlights the extended data box of the analysed Tyrrhenian coast.
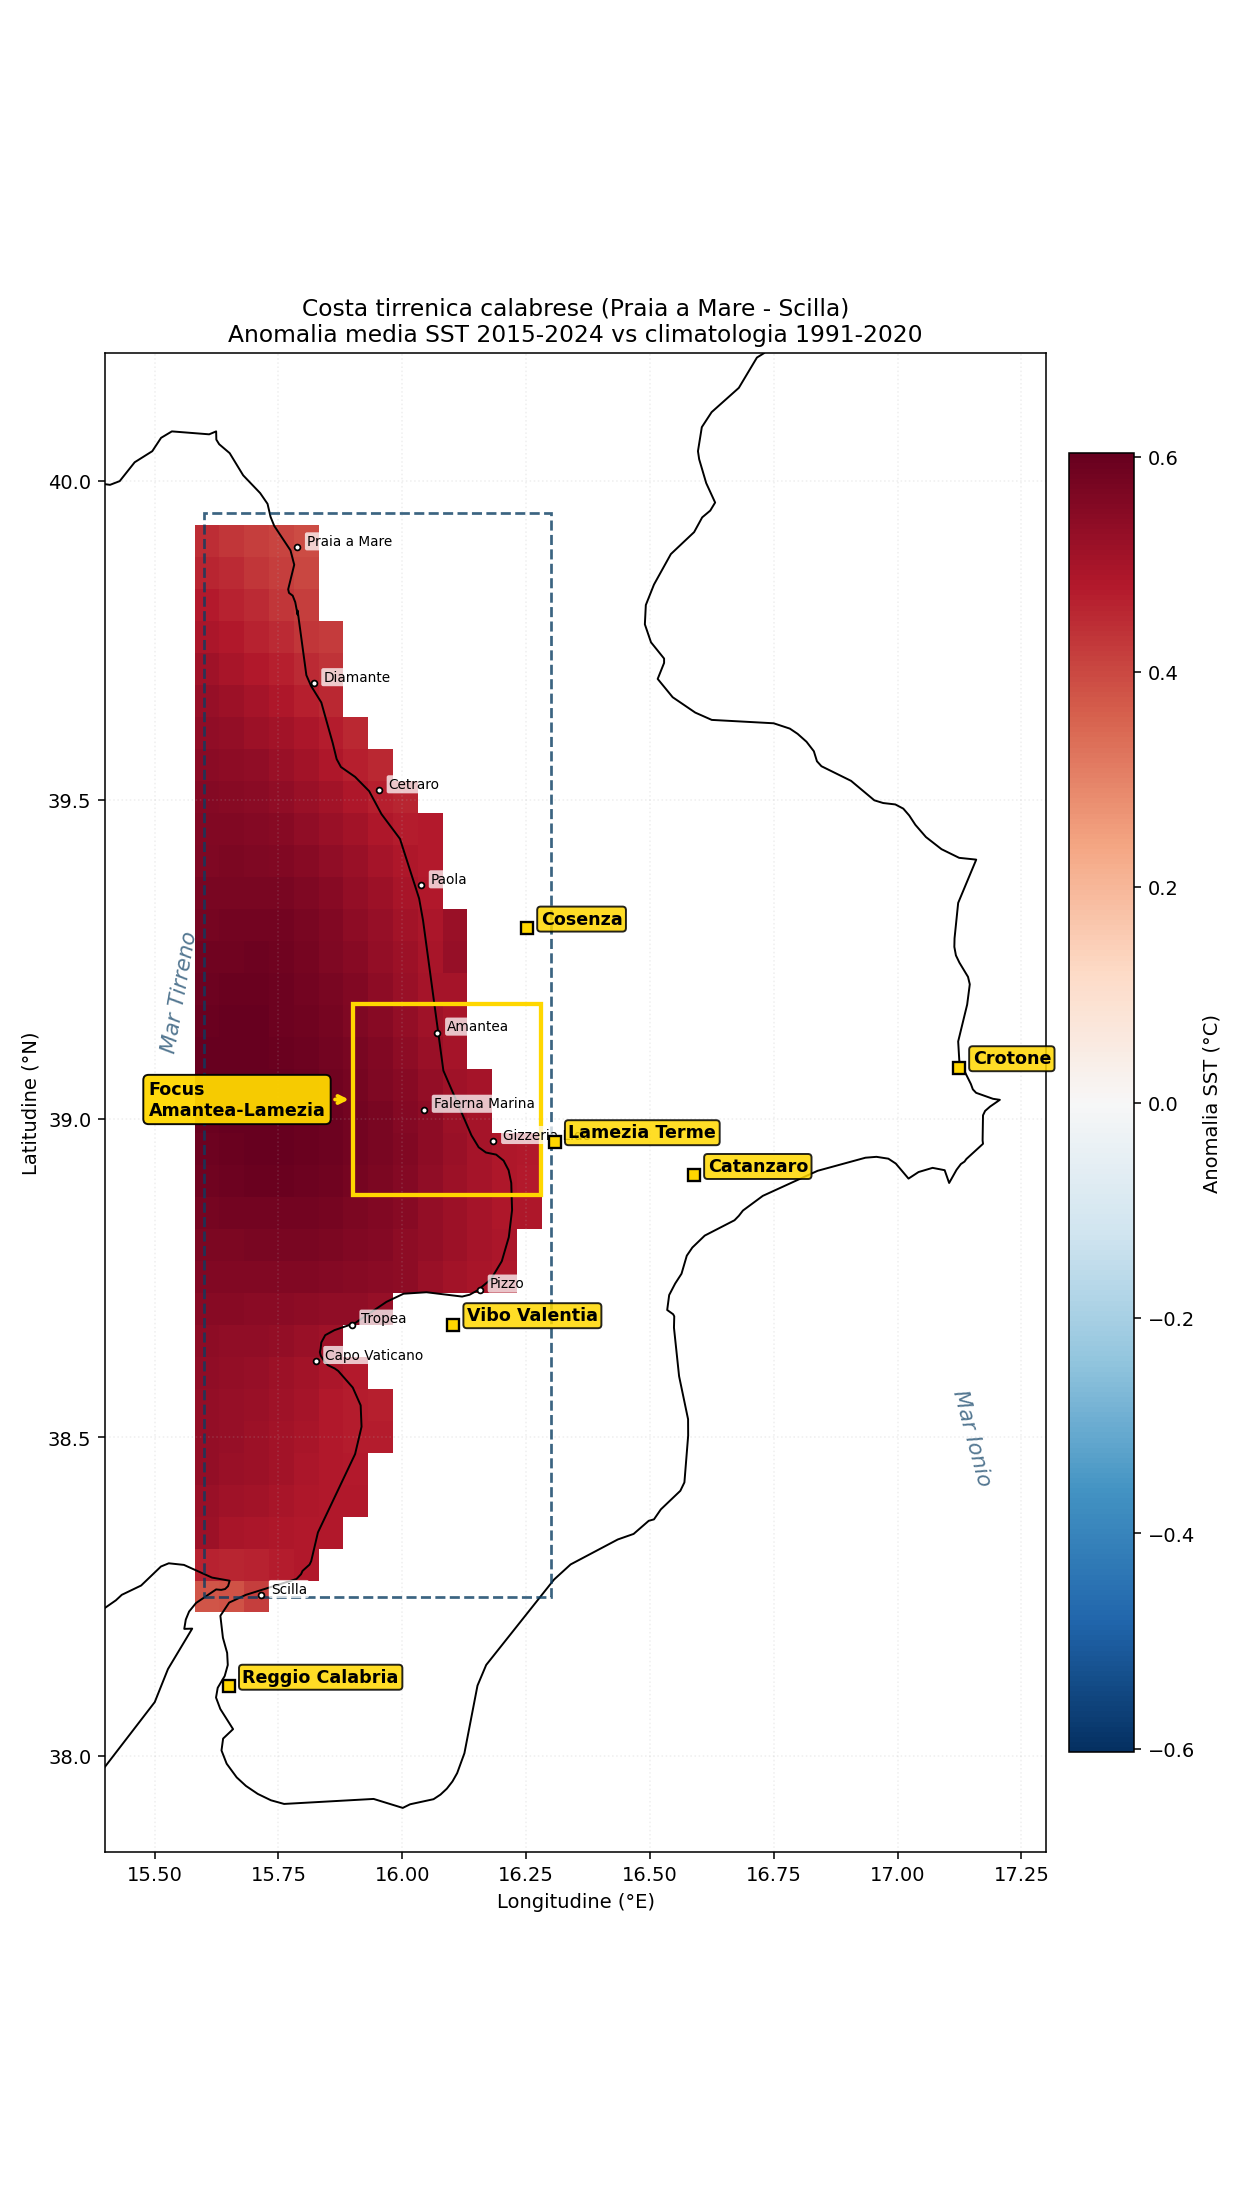
Figure 3.4 — Map of the mean SST anomaly 2015-2024 relative to the 1991-2020 climatology on the Calabrian Tyrrhenian coast.
The uniform colour is the first thing to notice: the whole Tyrrhenian coast of Calabria is reddened by about +0.5 / +0.6 °C, with no cooler zones that could act as a 'refuge'. There are no cooler marine microclimates within the analysed range. The zone of most intense colour (the highest anomaly) corresponds precisely to the Gulf of Sant'Eufemia, onto which the stretch from Amantea to Lamezia faces.
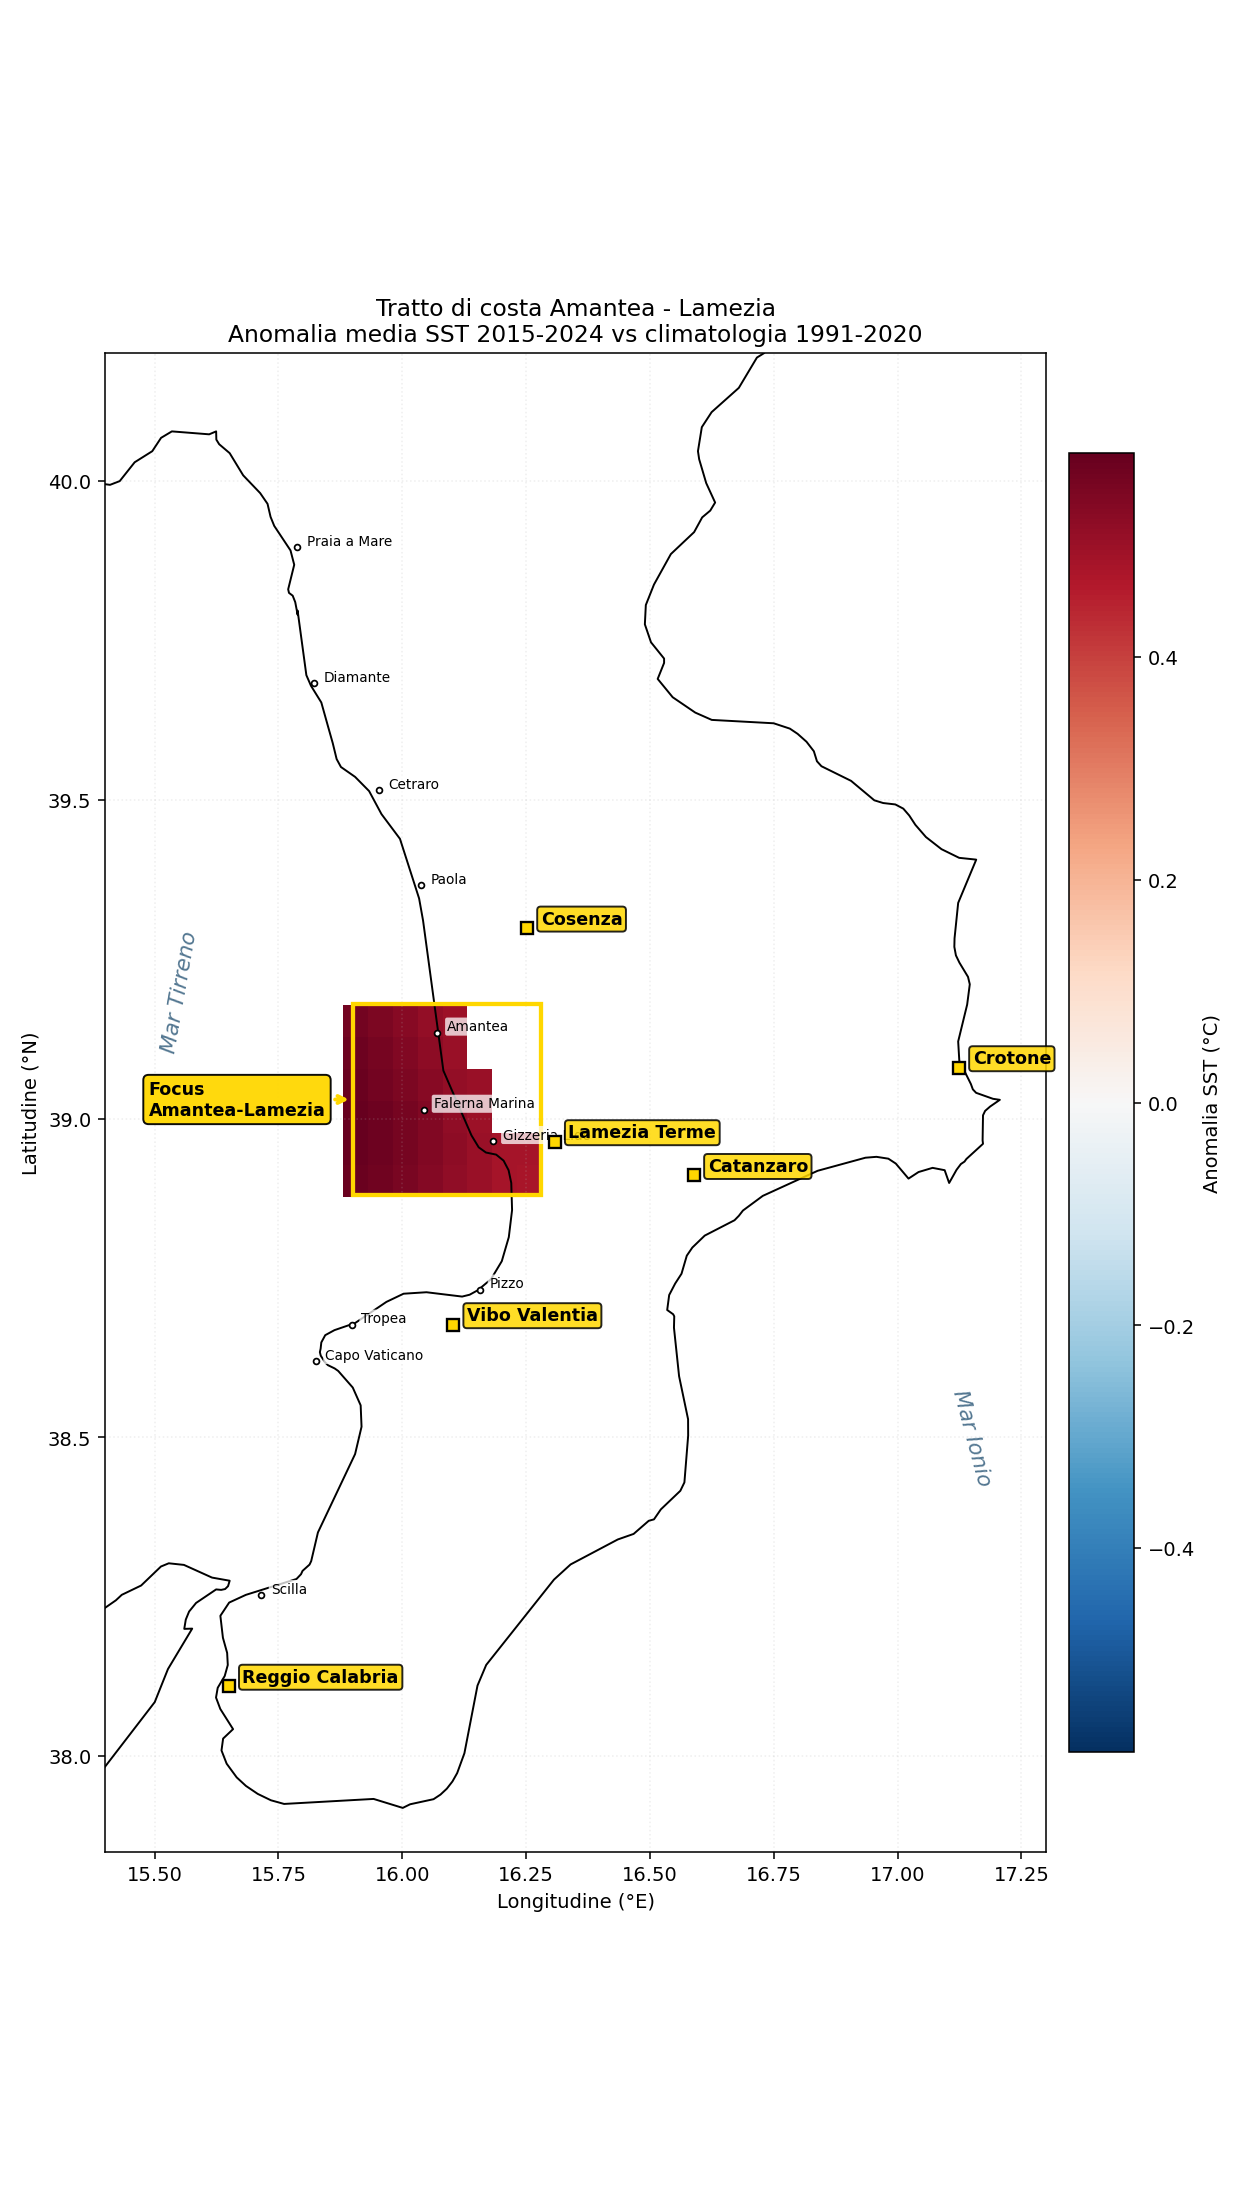
Figure 3.5 — The same representation as Figure 3.4, but with data available only for the restricted box of the Amantea-Lamezia focus.
3.5 The extension to the other three coasts: an unexpected discovery
So far the Tyrrhenian picture. When the study was extended to the other three Calabrian coastal stretches (Far South, South Ionian, North Ionian), we intuitively expected to find significant differences — above all an Ionian 'less warm' than the Tyrrhenian, given that the Calabrian Ionian coast historically suffers less from summer mucilage. The data refuted this hypothesis.
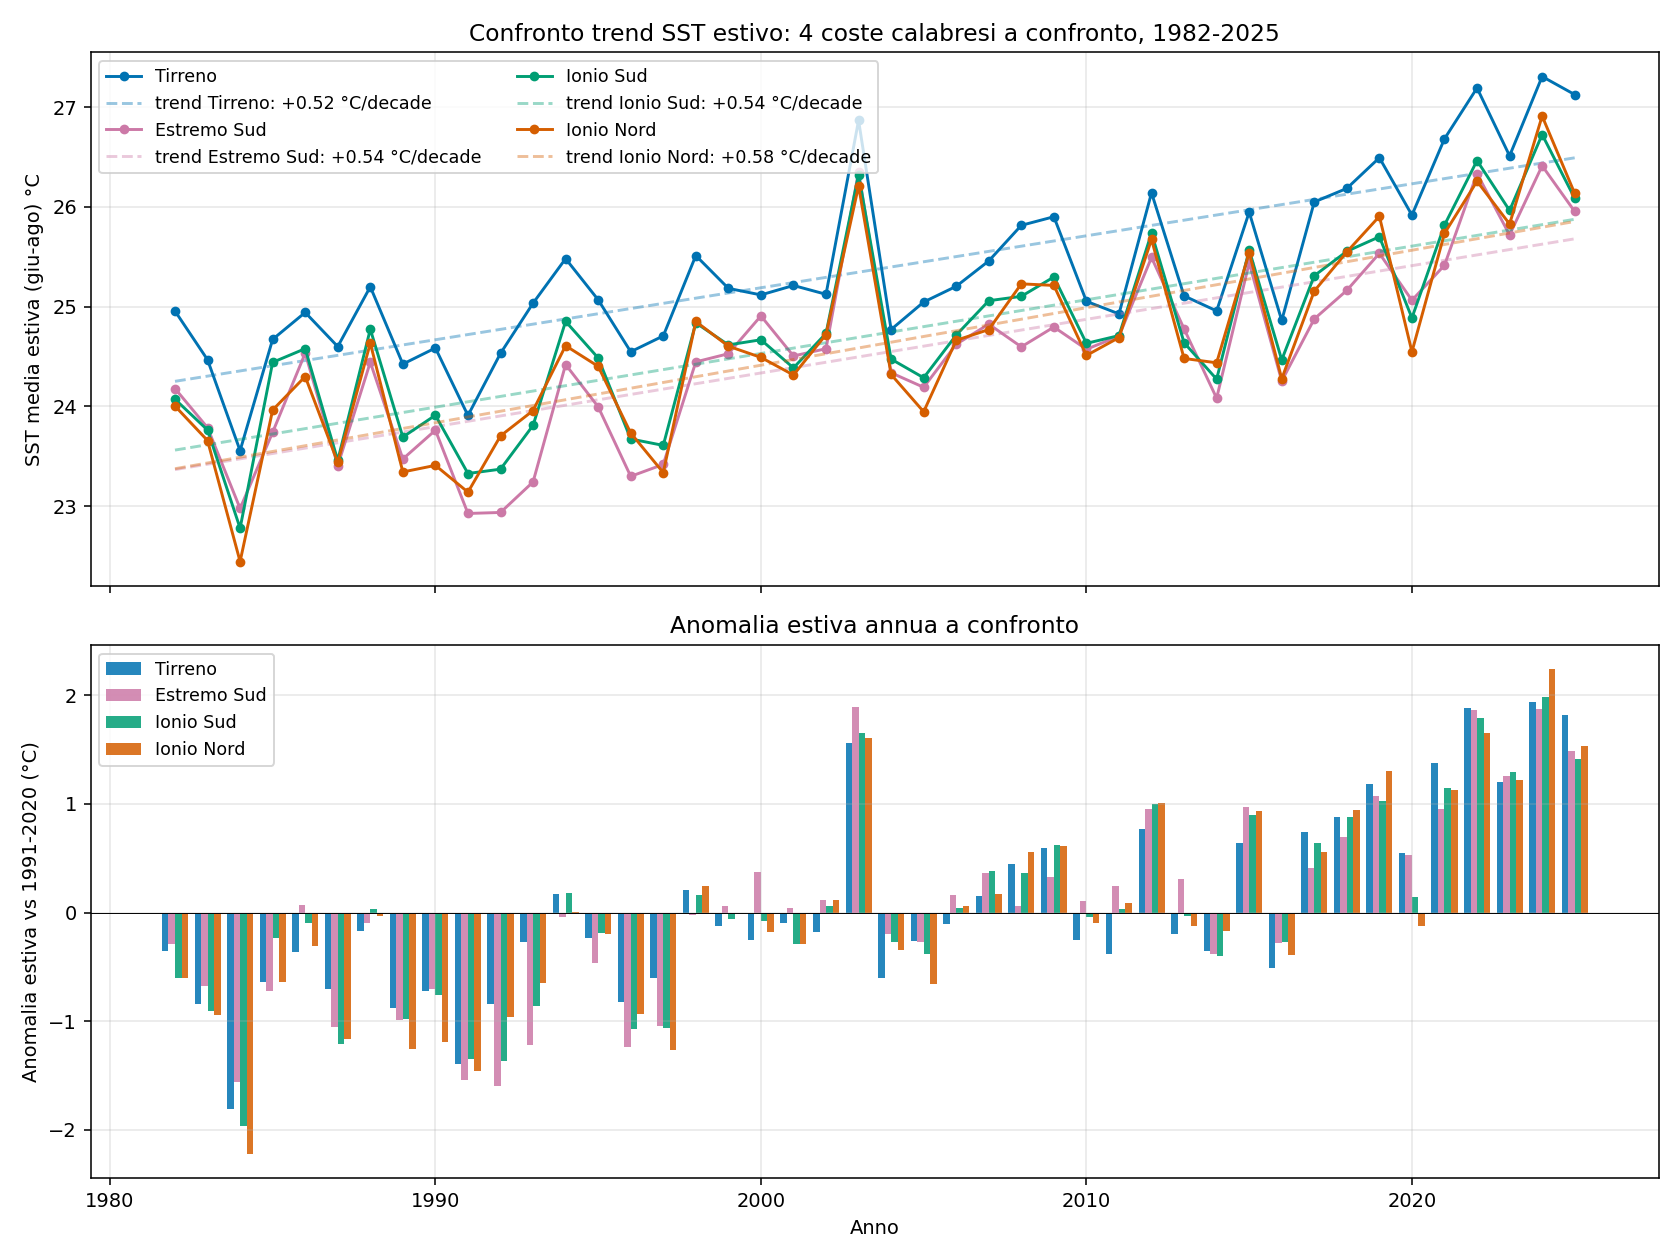
Figure 3.6 — Comparison of the summer SST trend for the four Calabrian coasts, 1982-2025. Upper panel: annual series of the mean summer SST (Jun-Aug) for each coast, with a linear regression line. Lower panel: annual summer anomaly relative to the 1991-2020 climatology. The four series are visibly aligned.
The key figures for each zone:
| Indicator | Tyrrhenian | Far South | South Ionian | North Ionian |
|---|---|---|---|---|
| Mean summer SST trend (°C/decade) | +0.52 | +0.54 | +0.54 | +0.58 |
| Mean summer SST 2024 (°C) | 27.31 | 26.41 | 26.73 | 26.91 |
| Summer anomaly 2024 (°C) | +1.94 | +1.88 | +1.98 | +2.24 |
| Maximum daily anomaly of the series (°C) | +4.24 (2023) | +3.95 (2022) | +4.07 (2022) | +4.39 (2024) |
| Change in summer SST 1982 vs 2024 (°C) | +2.30 | +2.30 | +2.40 | +2.60 |
Four counter-intuitive observations emerge from the table:
- The North Ionian has the steepest trend (+0.58 °C/decade) and the highest 2024 anomaly (+2.24 °C), greater than the Tyrrhenian (+1.94 °C). That is, precisely the historically 'quietest' coast is the one that is warming the most.
- The Far South (the Strait of Messina and the immediately adjacent Ionian) is the coolest coast of all: a 2024 summer SST of 26.41 °C, an anomaly of +1.88 °C. The presence of the strong currents of the Strait produces a measurable dynamic cooling effect, but it is only a local effect: the growth trend is practically the same as the other coasts.
- In absolute terms the summer SST of the Tyrrhenian is the highest (27.31 °C), but the difference with the other coasts is only ~0.5-0.9 °C, modest for biological purposes (marine species do not have such fine thresholds).
- The widespread idea that 'the Ionian is cooler, therefore it suffers less' is not supported by the data. The warming is uniform across the whole region; the differences in the coastal manifestations must be explained by other factors — wind, bathymetry, currents — which we will see in the next chapter.
3.6 Notable events of the historical series
To give names and dates to the statistical means, it is useful to list the years that deviated most markedly from the 1991-2020 climatological mean over the 44 years of the historical series. The following table combines summer anomalies (June-August) and annual anomalies to identify the 'off-the-scale' years in both directions.
| Year | What happened | Key anomaly | Notes |
|---|---|---|---|
| 1984 | Coldest summer of the series | -1.78 °C (summer) | The reference year for 'cold' conditions in the series |
| 1991 | Second-coldest summer | -1.43 °C (summer) | The last year clearly below the historical mean |
| 1994 | First significant warm summer | +0.14 °C (summer) | The start of the transition towards the 'warm' regime |
| 2003 | European heatwave (air too) | +1.53 °C (summer) | The year of the great continental heatwave; the first big 'jump' out of the historical envelope |
| 2018 | Generalised warming | +0.85 °C (summer) | Warm May, gorgonian events documented in the western Mediterranean |
| 2022 | Intense summer marine heatwave | +1.86 °C (summer) | Widespread gorgonian mortality events in the NW Mediterranean; maximum daily anomaly +4.04 °C |
| 2023 | Record year up to that point | +1.17 °C (summer) | Maximum daily anomaly +4.24 °C (absolute record) |
| 2024 | Warmest summer of the series | +1.97 °C (summer) | Record mean annual SST (21.33 °C); 275 MHW days |
| 2025 | Confirmation of the new regime | +1.79 °C (summer) | May +1.35 °C (record); max anomaly +4.15 °C |
Reading. All the years 'off the scale in the cold direction' are concentrated in the 1980s and the first half of the 1990s; all the years 'off the scale in the warm direction' are concentrated in the last 25 years, with a clear acceleration from 2018 onwards. The maximum daily anomalies shown (+4 °C and above) are particularly relevant because they represent the days of acute thermal stress, those that actually trigger ecosystem mortality.
4. Wind, bathymetry and currents: the real discriminants
If the sea temperature is not enough to explain the differences between the four Calabrian coasts, where do the real discriminating factors lie? Three answers intersect: wind (mean intensity and prolonged calm windows), bathymetry (the drop of the seabed), and currents (the renewal of the surface waters). This chapter analyses them one at a time and then combines them into a multifactor index of mucilage precursor preconditions.
4.1 Wind: the South Ionian is markedly windier than the Tyrrhenian
The wind over the sea surface has two effects that directly concern the preconditions for mucilage. Firstly, the wind stirs the surface water and breaks down the thermal stratification, mixing the warm surface layer with the cold deep one. Secondly, the wind disperses the gelatinous particles (TEP), preventing them from aggregating into macroscopic masses. A prolonged calm sea means stratification that does not break down and particles that accumulate; a windy sea means the opposite.
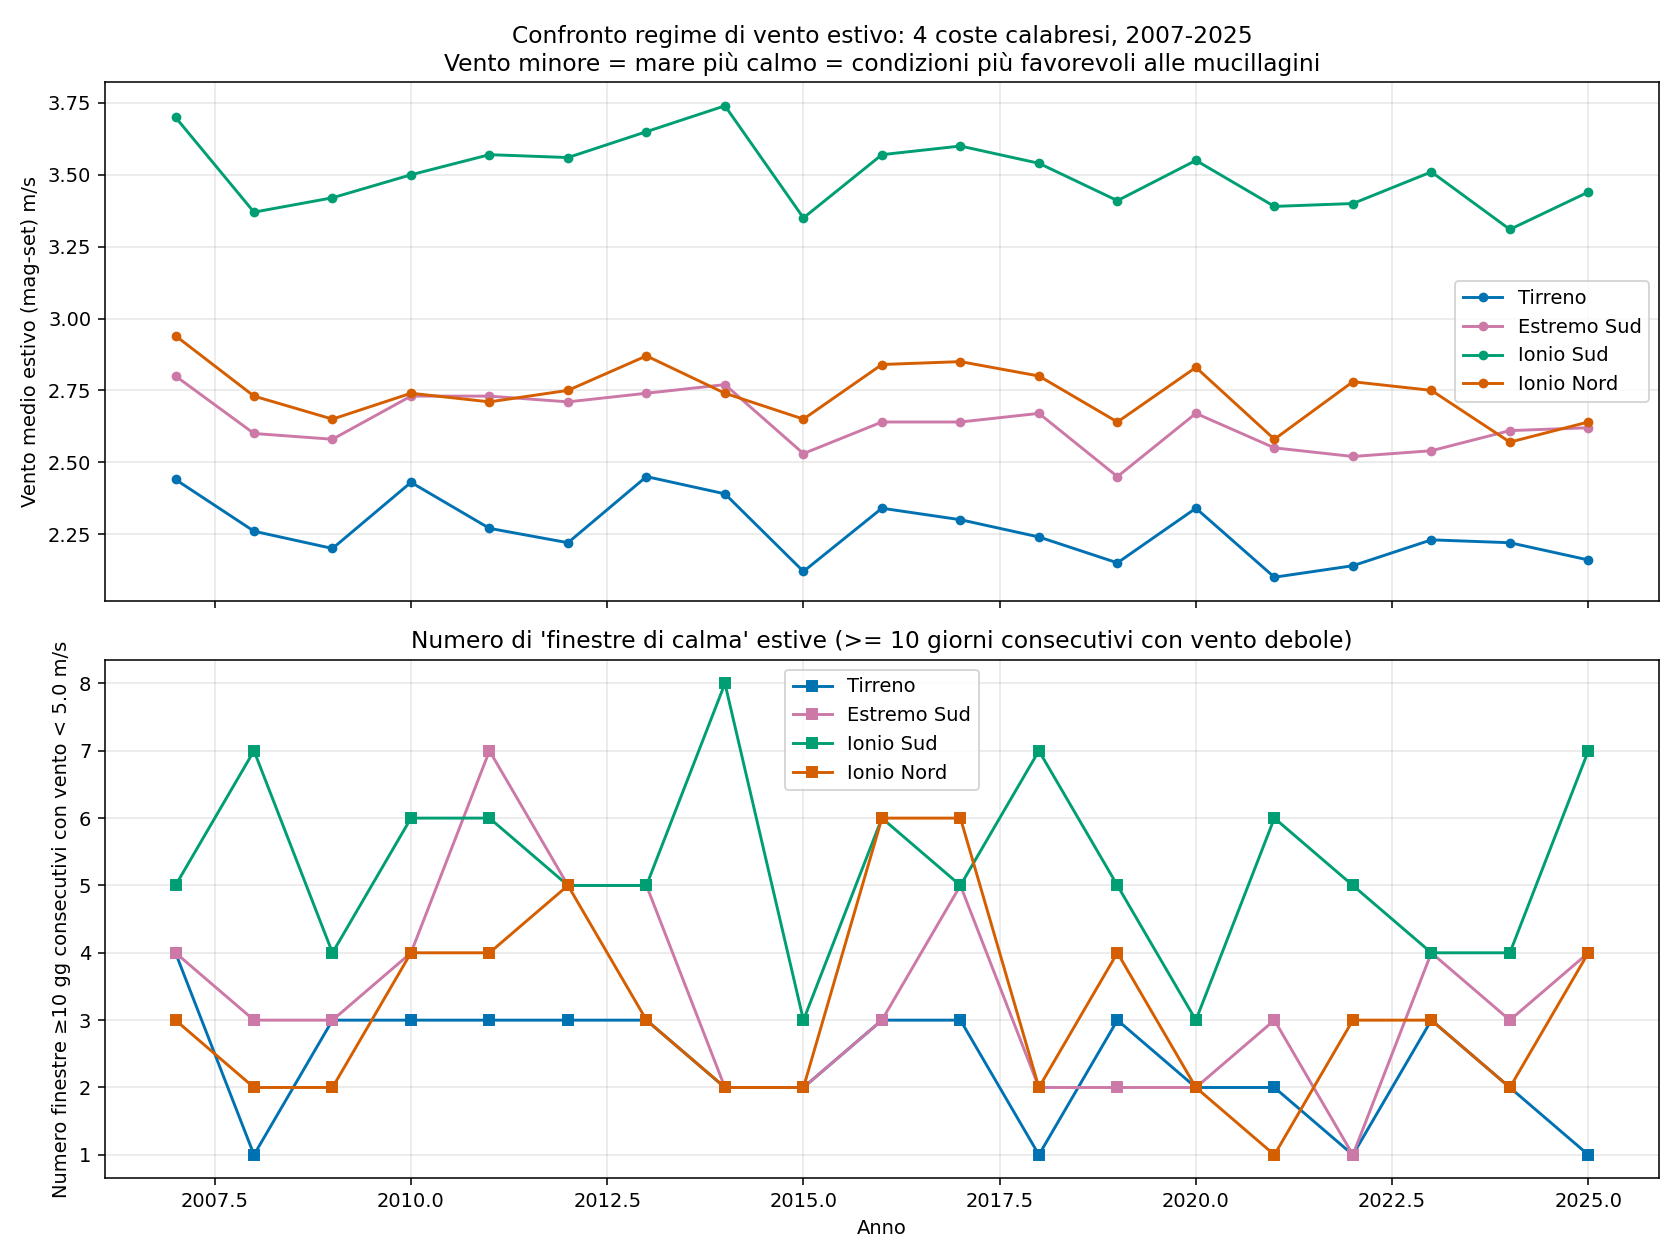
Figure 4.1 — Summer wind regime (May-Sep) for the four coasts, 2007-2025. Upper panel: annual mean summer wind. Lower panel: number of 'calm windows' (≥10 consecutive days with wind <5 m/s) per year. The South Ionian is structurally windier than the Tyrrhenian, but it also has more calm spells (a bipolar regime).
The figures (means over the period 2007-2025):
| Indicator | Tyrrhenian | Far South | South Ionian | North Ionian |
|---|---|---|---|---|
| Mean summer wind May-Sep (m/s) | 2.26 | 2.64 | 3.50 (+55%) | 2.74 |
| Calm windows >=10 days / year | 2.4 | 3.4 | 5.3 | 3.2 |
| Mean wind summer 2024 (m/s) | 2.22 | 2.61 | 3.31 | 2.57 |
| Calm windows 2024 (number) | 2 | 3 | 4 | 2 |
The South Ionian is the windiest of all (mean summer wind of 3.50 m/s against the 2.26 m/s of the Tyrrhenian: +55%). This is consistent with the atmospheric regime typical of the Calabrian Ionian coast, exposed to the Grecale-Levante winds that cross the Strait of Otranto and to the Sirocco winds that blow along the south-north axis of the Ionian Sea. The North Ionian has an intermediate regime (2.74 m/s) — slightly windier than the Tyrrhenian, partly screened by the promontory of Capo Colonna. The Far South (Strait-Reggio area-Bovalino) is also in an intermediate position (2.64 m/s), because of the channelling of the Strait of Messina that generates its own air currents.
There is, however, a counter-intuitive datum that deserves attention. The South Ionian, although the windiest on average, also has the highest number of prolonged calm windows: 5.3 per year against the 2.4 of the Tyrrhenian. This means a more bipolar regime (it alternates strong winds with prolonged calms), whereas the Tyrrhenian has a constant weak wind. For mucilage purposes, prolonged calm windows count more than the mean wind: a 15-day phase with SST >25 °C and wind below the threshold is exactly the perfect setup. This datum complicates the simplistic reading 'windy Ionian → no mucilage', and explains why mucilage events can still occur on the Ionian too when the conditions align.
Visual check with the Global Wind Atlas
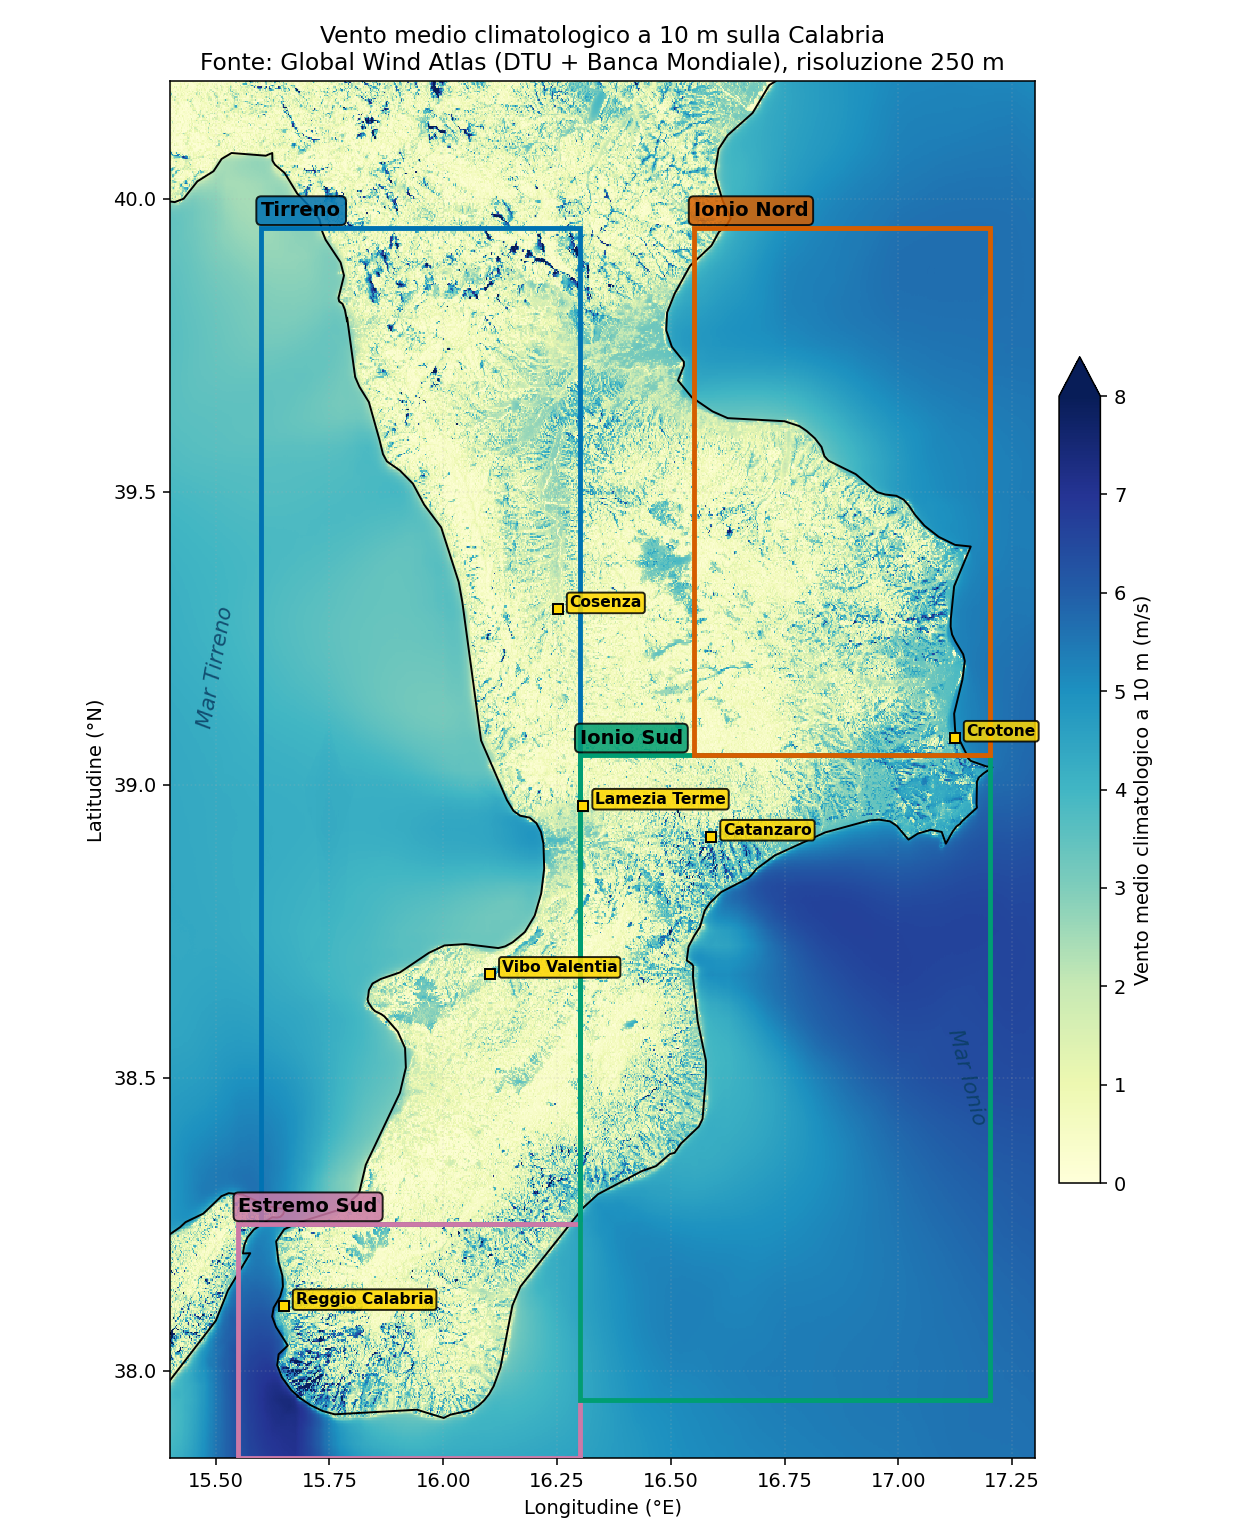
Figure 4.2 — Climatological mean wind at 10 m over Calabria, source Global Wind Atlas (DTU + World Bank), 250 m resolution. The four boxes indicate the analysed areas. Note the lighter colour (weak wind) over the Calabrian Tyrrhenian coast and in the Gulf of Sant'Eufemia, and the darker colour (stronger wind) over the South Ionian, especially offshore.
The Global Wind Atlas map, at 250 m resolution, makes visually evident some patterns that the box-aggregated Copernicus data do not show: the Tyrrhenian, in particular the Gulf of Sant'Eufemia, has light shades (2-3 m/s), confirming a weak and sheltered regime; the South Ionian off Locri-Soverato shows darker shades (4-5 m/s offshore); the North Ionian has intermediate shades. The mountainous interior (Pollino, Sila, Aspromonte) has markedly higher values, due to the mountain peaks: in these zones the GWA is less meaningful for coastal conditions, but useful as an orographic reference.
4.2 Bathymetry: the South Ionian is open sea, the Tyrrhenian is not
The second structural factor that differentiates the four coasts is bathymetry. A coast with an extended continental shelf (shallow seabeds for kilometres offshore) tends to stratify more easily, because the surface water layer is 'isolated' by a shallow water column. A coast with a rapid drop of the seabed (open sea a few km from the shore) instead has facilitated dynamic mixing, because the circulation of the deep water masses can interact with that of the surface.
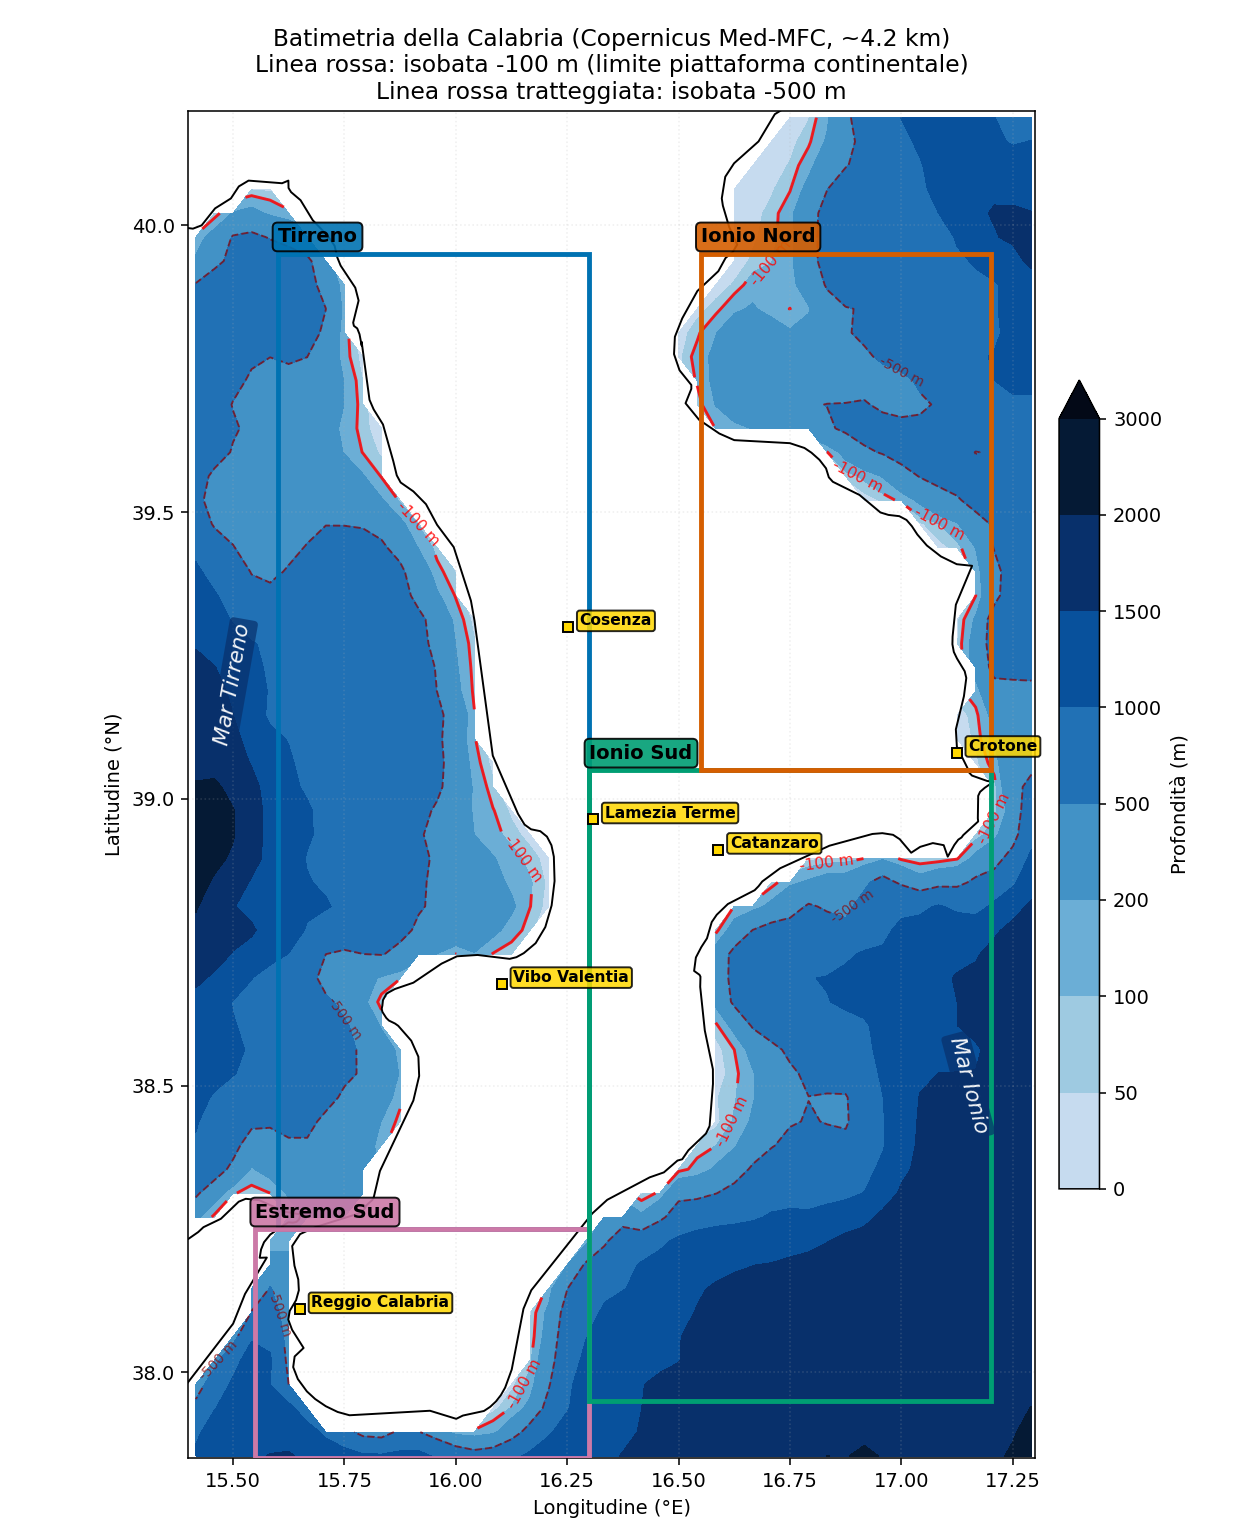
Figure 4.3 — Bathymetry of Calabria with the 4 analysis boxes. Colours from light blue (shallow waters) to dark blue (>3000 m). The solid red line is the -100 m isobath (the conventional limit of the continental shelf); the dashed red line is the -500 m isobath. An evident contrast between the Tyrrhenian (an extended shelf, especially the Gulf of Sant'Eufemia) and the South Ionian (a rapid drop within less than 5 km of the coast).
| Bathymetric indicator | Tyrrhenian | Far South | South Ionian | North Ionian |
|---|---|---|---|---|
| Mean depth of the box (m) | 493.8 | 697.7 | 1093.6 | 441.3 |
| Median depth (m) | 491.8 | 666.4 | 1189.5 | 412.7 |
| % of area with depth <= 50 m | 3.4% | 3.7% | 1.8% | 6.1% |
| % of area with depth <= 100 m (shelf) | 9.2% | 6.1% | 5.4% | 14.1% |
| % of area with depth <= 200 m (margin) | 19.8% | 19.5% | 8.4% | 23.3% |
| % of area with depth <= 500 m | 50.9% | 39.0% | 19.6% | 59.5% |
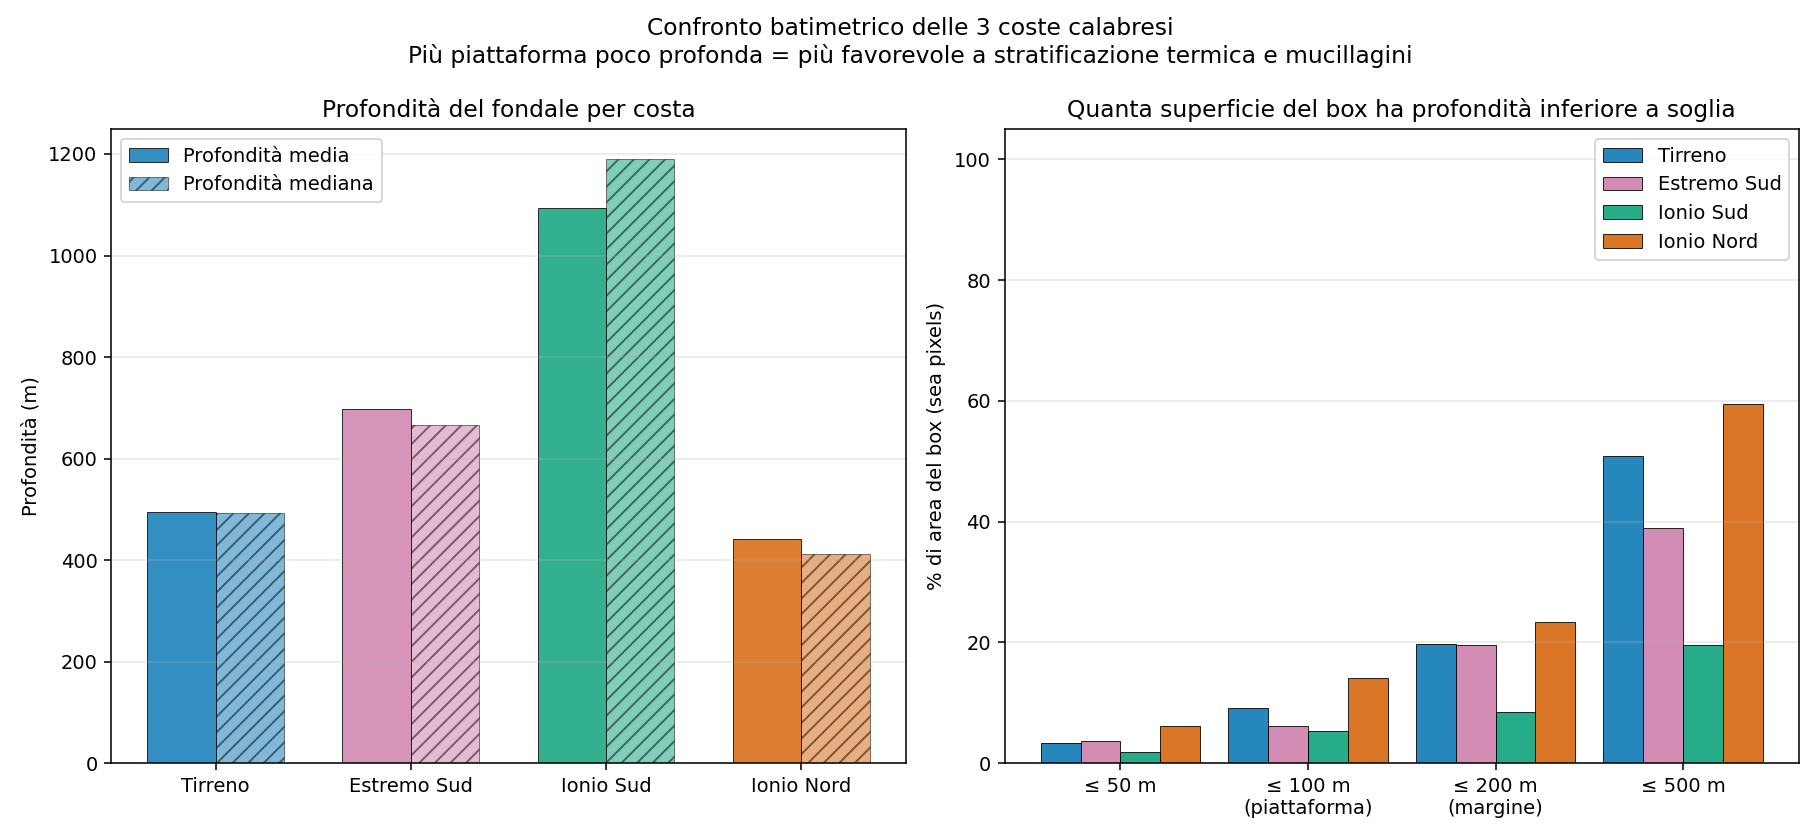
Figure 4.4 — Bathymetric comparison between the four coasts. Left: mean and median depth per box. Right: percentage of the area of each box with depth less than 50, 100, 200, 500 m.
The four coasts have very different bathymetric structures
The most surprising result of this analysis is that Calabrian bathymetry is not uniform: four coasts, four profoundly different profiles.
- The South Ionian (Locri-Soverato-Catanzaro Marina) has a mean depth of 1,094 m: more than double the Tyrrhenian (494 m). Only 19.6% of the area has a depth <=500 m, against 50.9% of the Tyrrhenian. It is structurally the most 'open sea' of the four coasts, with a rapid drop of the seabed and facilitated dynamic mixing. This characteristic, combined with the stronger wind, robustly explains why the South Ionian suffers less from mucilage.
- The Far South (Strait-Reggio area-Bovalino) has a mean depth of 698 m, intermediate between the Tyrrhenian and the South Ionian. The continental shelf <100 m is reduced (6.1%), lower than the Tyrrhenian (9.2%) and the North Ionian (14.1%). But here an additional factor acts: the strong currents of the Strait of Messina, which reverse every 6 hours (the famous tidal streams), add a powerful dynamic effect, independent of the seabed depth.
- The North Ionian (Crotone-Cirò-Sibari plain), by contrast, is structurally similar to the Tyrrhenian: a mean depth of 441 m (in fact slightly less than the Tyrrhenian), 14.1% of area with a shelf <=100 m (against the 9.2% of the Tyrrhenian). It is favoured by the promontory of Capo Colonna and by the alluvial plain of Sibari. It is therefore normal that it shows MHW values and thermal anomalies similar to or even higher than the Tyrrhenian.
- The Tyrrhenian has the peculiarity of the Gulf of Sant'Eufemia (about 25 km wide, with shallow seabeds) which creates an area of particularly stable stratification. It is precisely in this gulf that the Amantea-Lamezia stretch at the centre of the original study falls, and which presents the strongest mucilage precursor preconditions of the four coasts.
So the qualitative hypothesis 'bathymetry explains the differences' must be reformulated in a more nuanced way: it clearly explains why the South Ionian is less affected (a rapid drop = mixing), and is consistent with the coolness of the Far South (the currents of the Strait + a significant bathymetric drop). But it does NOT explain why the North Ionian seems to suffer less than the Tyrrhenian in mucilage reports — indeed, from a structural point of view it is similar or more favourable to the formation of the same. There, social factors probably come into play (less concentrated tourism, fewer reports) or specific nutrients/currents.
4.3 Currents
The Tyrrhenian and the Ionian have fundamentally different circulation regimes. The southern Tyrrhenian is dominated by an anticyclonic circulation with semi-stationary eddies, especially in the gulfs (Sant'Eufemia, Squillace): low mean speed, slow water renewal. The waters tend to 'stay' in the gulf for weeks before being replaced, favouring stratification and surface oligotrophication.
The Ionian, by contrast, is crossed by the Atlantic Ionian Stream (AIS), a current that enters from the Sicily Channel and runs along the northern edge of the Ionian Sea in a generally dynamic way. Higher mean speeds, faster renewal of the surface waters. More renewal means less time for the phytoplankton cells to enter prolonged stress and accumulate exopolysaccharides. It is an explanation complementary to bathymetry for the lower incidence of mucilage on the Ionian.
The Far South is dominated by the currents of the Strait of Messina, literally unique in the Mediterranean. The difference in sea level between the Tyrrhenian and the Ionian (of a few centimetres, but significant) creates currents that reverse direction every 6 hours, reaching speeds of 2-3 m/s at the narrowest points. It is an extremely effective mixing mechanism, independent both of the surface wind and of the local bathymetry. It is this that explains the structurally cooler summer SST of the Far South (26.41 °C in 2024) despite the low latitude.
4.4 The multifactor mucilage-precondition index
By combining the two measurable meteo-marine factors (thermal and mechanical), a composite index of mucilage precursor preconditions was built for each of the four coasts, normalised 0-100 and available for the period of overlap of the two datasets (2007-2025). The index does not directly measure the presence of mucilage (which also depends on nutrients and biology, not measured here), but quantifies how favourable the meteo-marine conditions are to their formation.
Composition of the index (weights 50% thermal + 50% mechanical):
- 20% mean May SST (percentile rank over the whole series)
- 15% earliness of the first day with SST ≥22 °C (the earlier, the worse)
- 15% number of days in the critical 24-28 °C window
- 25% number of summer calm windows ≥10 days
- 25% mean summer wind (the lower, the worse)
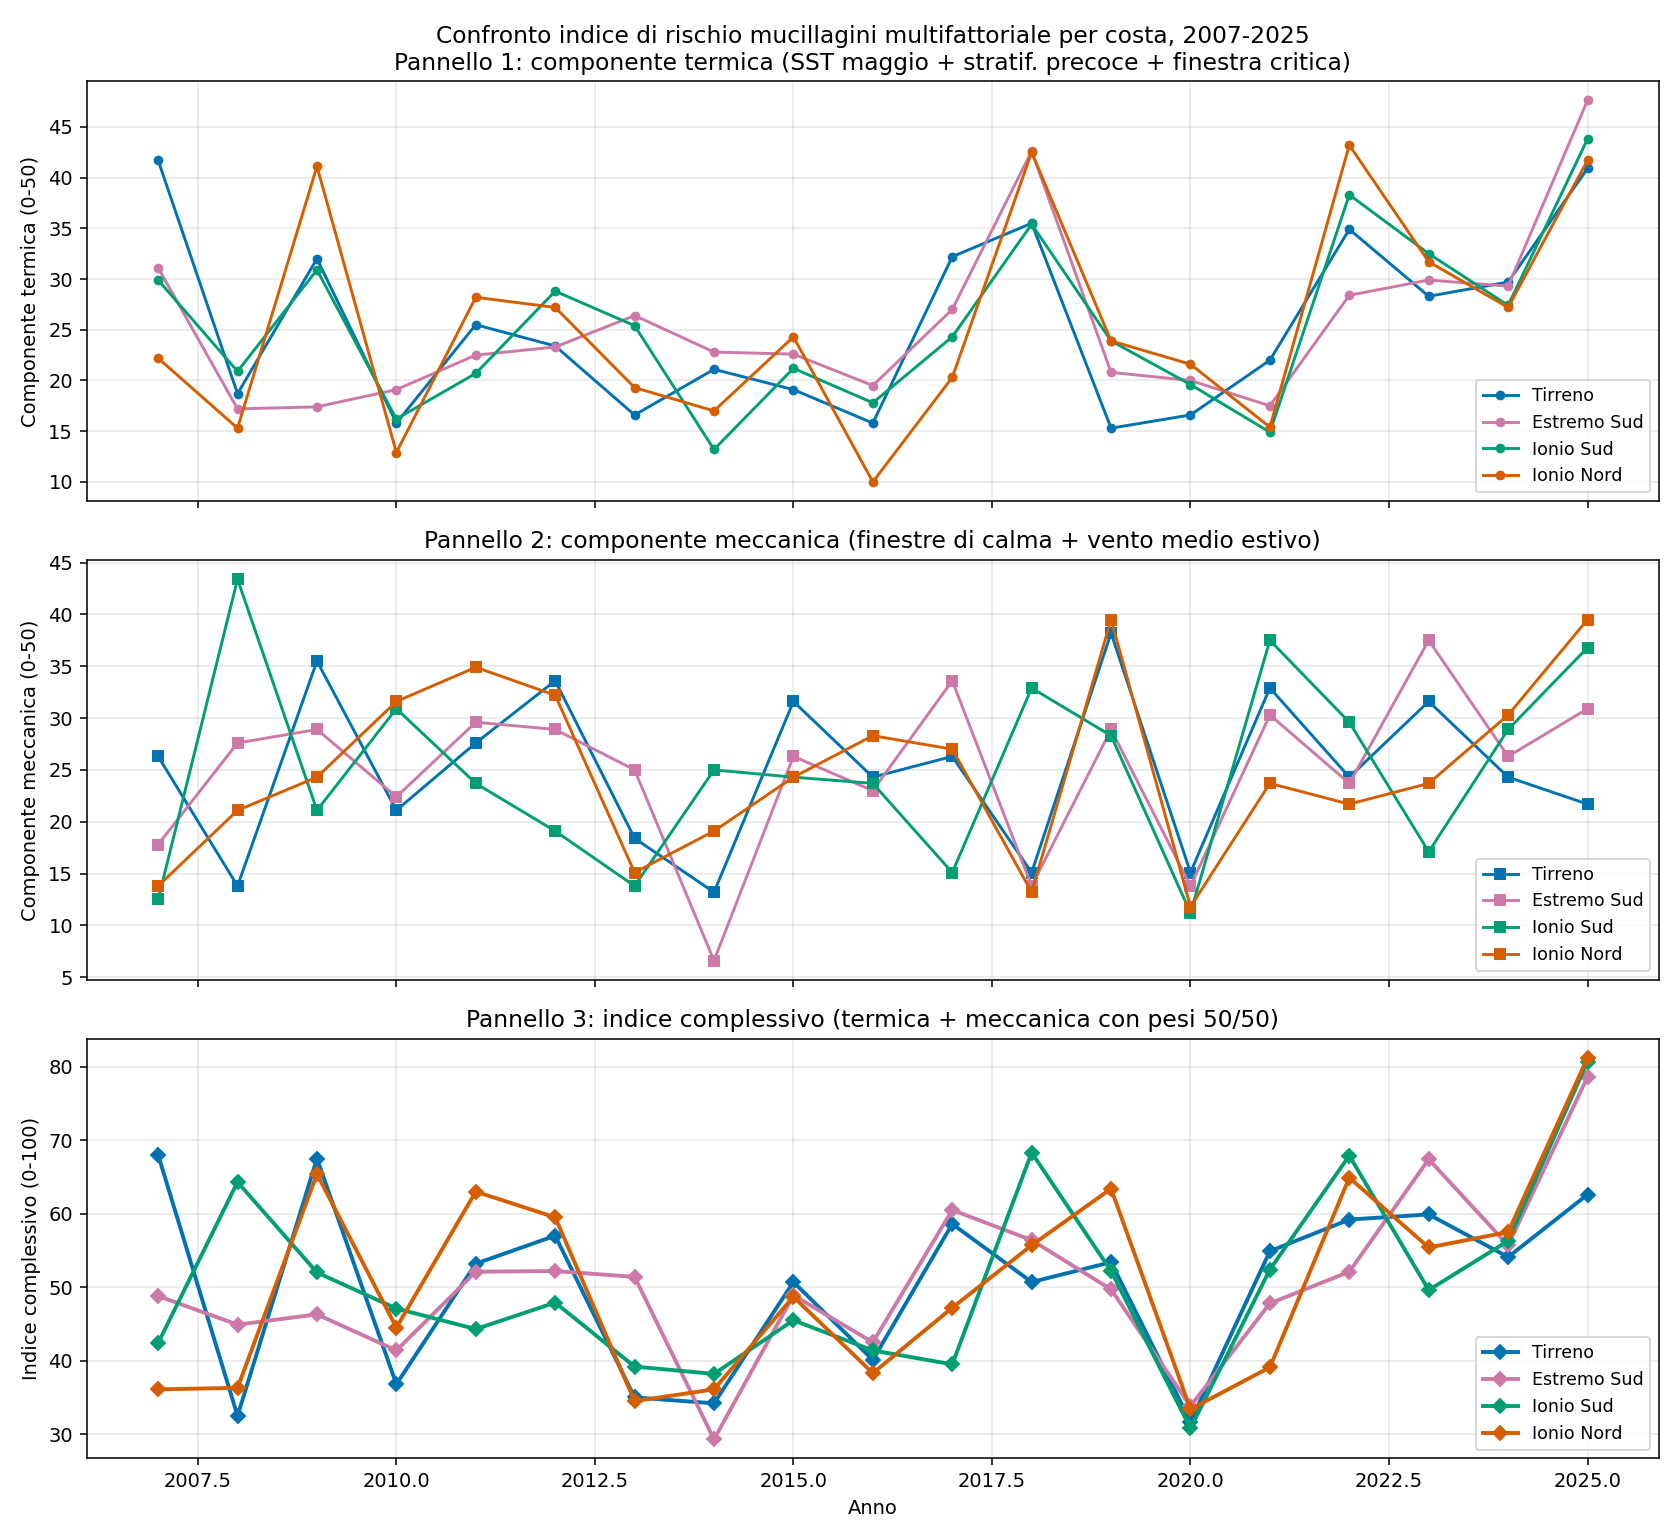
Figure 4.5 — Multifactor index of mucilage precursor preconditions for the four Calabrian coasts, 2007-2025. Panel 1: thermal component only. Panel 2: mechanical component only (wind). Panel 3: overall index (thermal + mechanical with 50/50 weights).
What the index reveals:
- The thermal component is practically indistinguishable between the four coasts. It confirms that, from the heat point of view alone, the Ionian is as exposed as the Tyrrhenian and the Far South only marginally less.
- The mechanical component clearly differentiates the South Ionian (low values: high wind = less favourable to mucilage) from the Tyrrhenian (high values: low wind = more favourable), with the North Ionian and the Far South in intermediate positions.
- In the overall index, the Tyrrhenian emerges as the coast with the thermal + mechanical conditions most favourable to mucilage formation, and the South Ionian as the least favourable. The North Ionian is in an intermediate position but closer to the Tyrrhenian.
An important caveat: this index measures only the meteo-marine precursors. It does not include nutrients (river inputs, discharges), the composition of the phytoplankton, the local currents — all factors that are crucial for explaining why an event actually occurs or not. To make mucilage you need SST + wind + nutrients + the right species; the index measures only the first two terms.
4.5 The third factor: nutrients and biogeochemical productivity
The original study had quantified only two of the three triggering factors of mucilage (the thermal and the mechanical). The third remained open: nutrients — nitrogen and phosphorus dissolved in the surface layer, which the phytoplankton consumes to grow and which, in conditions of scarcity, send it into stress, producing extracellular polysaccharides (the EPS, the building blocks of mucilage). To close the triangle, a third Copernicus Marine dataset was downloaded, dedicated to the biogeochemistry of the Mediterranean.
The MedBFM model (OGS Trieste)
Unlike SST and wind, which are direct satellite measurements, the biogeochemical data are not visible from space: one cannot measure a nitrate at 2 metres depth with an infrared sensor. For this reason Copernicus produces them with a numerical model called Med-BFM (Mediterranean BioGeoChemical Flux Model), developed and maintained by OGS — the National Institute of Oceanography and Experimental Geophysics of Trieste. The model simulates on a computer, hour by hour and pixel by pixel, the interactions between about 50 biogeochemical variables (4 groups of phytoplankton, 3 of zooplankton, bacteria, organic matter, oxygen, the carbon cycle, the nutrient cycles), on a Mediterranean grid of 4.2 km × 4.2 km × 125 vertical levels.
To prevent the model from drifting away from reality, Copernicus applies so-called data assimilation: the system is periodically corrected with the available observations — satellite chlorophyll (the colour of the sea), BGC-Argo floats (autonomous floats that measure nutrients and oxygen in situ every 10 days), oceanographic campaigns on Italian, French and Spanish ships. The final product we use is therefore a model CALIBRATED on observed reality, not a blind simulation.
A necessary caveat: unlike SST (uncertainty ~0.2 °C, high reliability), the BGC data have larger uncertainties. The official Copernicus validation indicates an RMSE of ~30% for chlorophyll and ~40% for nitrates. For our analysis this means that they must be used as RELATIVE indicators (zone A vs zone B, year X vs year Y) and not as precise absolute concentrations. The comparison pattern remains robust.
The surprising datum: the Tyrrhenian is NOT the most 'fertile'
The 1999-2024 mean values of the two key indicators — the N:P ratio (nitrate/phosphate) in the pre-seasonal layer, and the summer primary productivity (NPP) in the months of July-August — are the following:
| Biogeochemical indicator | Tyrrhenian | Far South | South Ionian | North Ionian |
|---|---|---|---|---|
| NO3 May-Jun (μM) | 0.503 | 0.555 | 0.588 | 0.596 |
| PO4 May-Jun (μM) | 0.009 | 0.009 | 0.006 | 0.005 |
| N:P ratio (vs Redfield 16) | 59 | 73 | 102 | 119 |
| Summer NPP (mgC/m³/day) | 7.15 | 7.70 | 8.52 | 10.36 |
| Summer-peak NPP | 8.26 | 10.44 | 11.06 | 13.92 |
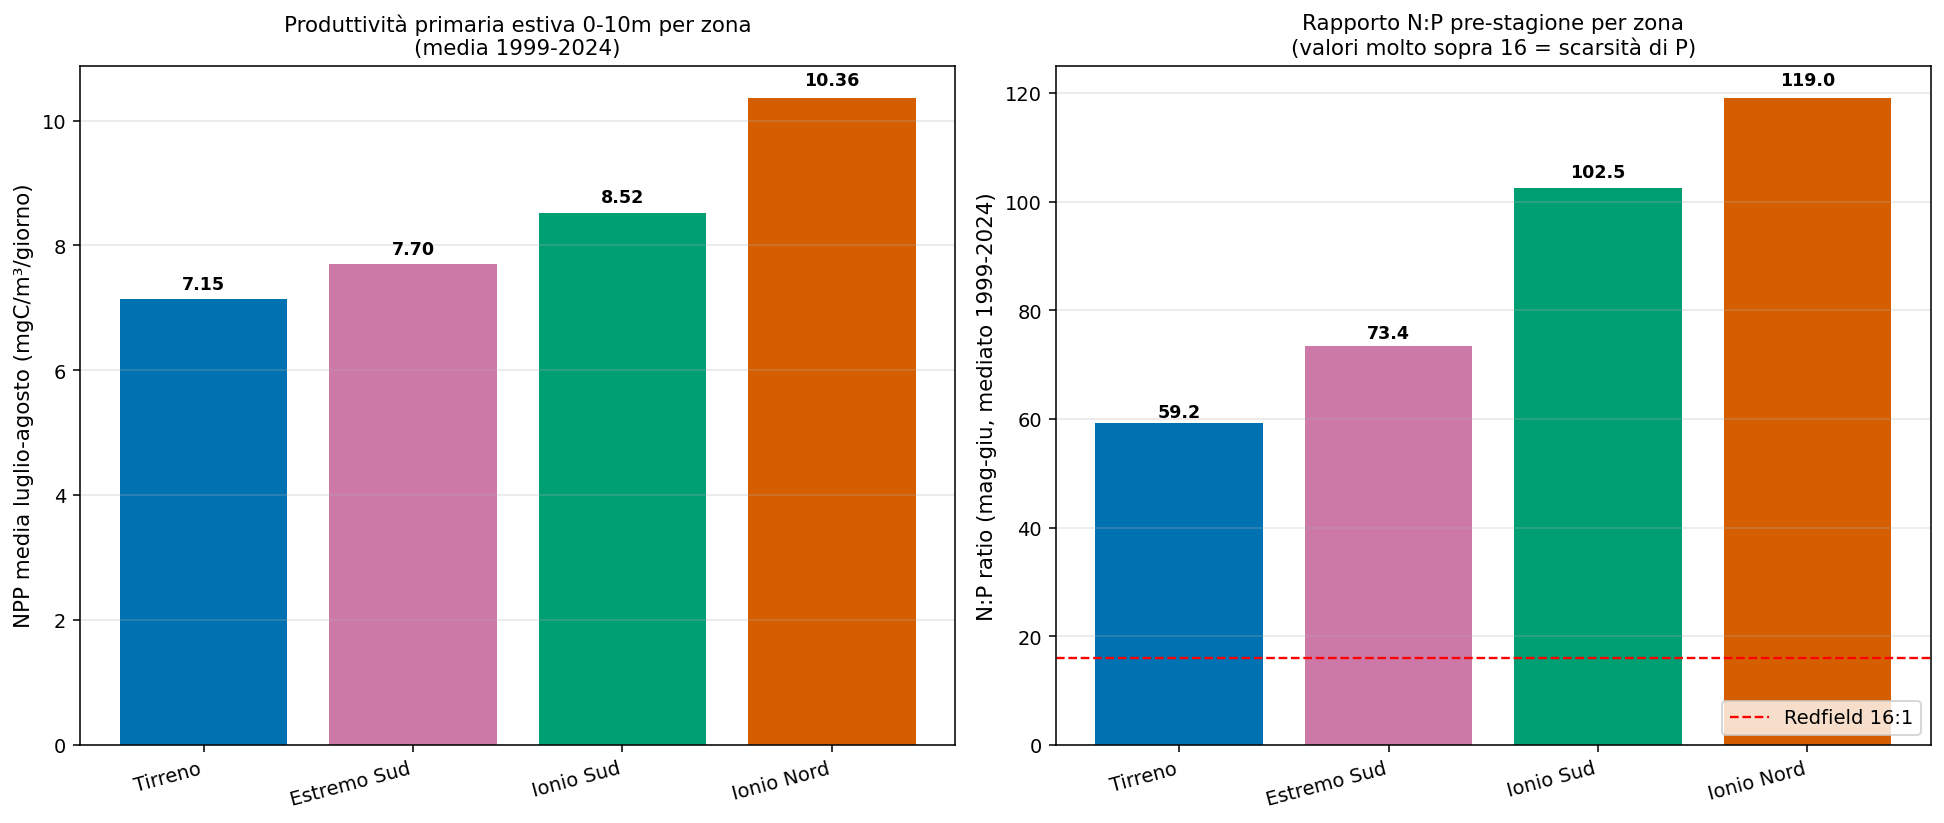
Figure 4.6 — Comparison of the four Calabrian coasts for summer primary productivity (left) and pre-season N:P ratio (right), 1999-2024 means from the MedBFM model. The North Ionian has the highest N:P (119) and the highest NPP (10.36) — the opposite of what one might expect.
The result is counter-intuitive. The North Ionian — the zone with the LOWEST frequency of documented mucilage events — has at the same time the highest N:P ratio (119 against a 'healthy' Redfield value of 16, almost 8 times higher) and the highest summer primary productivity of the four Calabrian coasts. The Tyrrhenian, paradoxically, has the lowest values: N:P 59 and NPP 7.15, the MINIMUM of the four coasts. In pure theory, it would be the North Ionian that is the zone most predisposed to mucilage, not the Tyrrhenian.
What this apparent anomaly tells us
The apparent contradiction rigorously confirms what was only a hypothesis in the previous reports: for Calabrian mucilage the mechanical factor (wind + bathymetry + AIS currents) is DOMINANT over the nutritive factor. The North Ionian produces a lot of gelatinous 'raw material' (high EPS) but the dynamic mixing (a rapid drop of the seabed, moderate wind, the AIS) disperses it before it aggregates into visible mucilage. The Tyrrhenian produces less 'raw material' but conserves it in an oligotrophic, calm, stratified sea — and little is needed for it to accumulate.
For the Tyrrhenian this datum is objectively positive news and has direct implications for the public narrative. If the Tyrrhenian were really a sewer (as one often hears said), we would find HIGH nitrates and phosphates — faecal discharges are rich in both. Instead we find the LOWEST values of Calabria. Any mucilage does not come from Tyrrhenian discharges (which would leave a chemical signature), it comes from physical-climatic mechanics: a calm sea, semi-enclosed gulfs, shallow seabeds, progressive warming. In other words: the Calabrian Tyrrhenian coast has the cleanest water chemistry of the four coasts, but the sea physics least favourable to dispersion.
Independent check with another 4 biogeochemical indicators
The analysis of NO3 and PO4 alone was subsequently extended with four complementary indicators, using completely different Copernicus datasets (in particular satellite observations independent of the MedBFM model). The complete details are in the technical appendix Relazione_BGC_Mucillagini.docx (chapters 8-11); here we summarise the key result:
| Additional indicator | Tyrrhenian | Far South | South Ionian | North Ionian | Reading for the Tyrrhenian |
|---|---|---|---|---|---|
| Observational satellite chlorophyll | 0.046 | 0.060 | 0.062 | 0.087 | Tyrrhenian CLEAREST (an independent confirmation of the model) |
| Satellite KD490 turbidity | 0.026 | 0.028 | 0.029 | 0.033 | Tyrrhenian the most TRANSPARENT of the 4 coasts |
| Summer pH (acidification) | 7.99 | 8.01 | 8.02 | 8.02 | Practically identical between coasts (no local signature) |
| Summer salinity (PSU) | 37.85 | 38.59 | 38.74 | 38.66 | Tyrrhenian fresher, but due to natural Atlantic circulation |
The four checks all converge on the same conclusion: the Calabrian Tyrrhenian coast has the optically most transparent, chemically most nutrient-poor and biologically least productive waters of the four coasts. The pattern is confirmed by independent methodologies (the MedBFM model, the Ocean Colour 1km satellite, the Med-MFS physical model). Six proofs, six datasets, one single conclusion: the Tyrrhenian has no signature of differential pollution relative to the other Calabrian coasts.
Four deeper analyses of May 2026 — a complete check
After the first six indicators, the analysis was extended with four further Copernicus datasets to close every possible methodological doubt. The complete details are in the technical appendix Relazione_BGC_Mucillagini (Ch. 12). Here we summarise the outcomes:
| Deeper analysis | What it measures | Key result |
|---|---|---|
| PFT — Plankton Functional Types | Phytoplankton composition by functional group (CRYPTO, DINO, DIATO, GREEN, HAPTO, NANO, PICO, PROKAR) | Resolves the enigma of the July 2024 Pyramimonas bloom: the satellite DOES see the bloom (CRYPTO +199.8%, DINO +34.7%) but as a COMPOSITIONAL EXCHANGE, not as a total increase in biomass. |
| MLT — Mixed Layer Thickness | A DIRECT measurement of thermal stratification (vs the SST+wind proxy) | Summer: all 4 coasts ~12m (strong stratification). Winter: Tyrrhenian 58m, North Ionian 132m — the North Ionian 'resets' more deeply, explaining its greater annual biomass. |
| ZSD — Secchi depth | Water transparency in METRES (derived from KD490) | Tyrrhenian: summer transparency ~180m (the maximum of the 4 coasts). North Ionian: ~144m. Communicatively strong for the public. |
| OMI MSFD — EU Eutrophication indicator | The official EU Ocean Monitoring Indicator for the Marine Strategy Framework Directive descriptor 5 | All 4 Calabrian coasts show a NEGATIVE chlorophyll trend 1997-2024 (Tyrrhenian -12%/decade, Far South -19%/decade), much faster than the whole Mediterranean (-0.5%/decade). An official EU validation that the Calabrian sea is improving on the eutrophic profile. |
With these four deeper analyses the picture is complete: ten independent biogeochemical indicators, ten different datasets, one single conclusion — the Calabrian Tyrrhenian coast is not differentially polluted. Any local bloom (e.g. Pyramimonas at Colamaio in July 2024) is a phenomenon of compositional exchange of the phytoplankton, ultra-coastal and short-lived, compatible with a regional sea that for almost three decades has been progressively improving.
4.5.5 Bloom count 1999-2024 (a check on the frequency of Pyramimonas)
To answer the question 'are blooms like that of Pyramimonas in July 2024 recurring or exceptional?' we counted automatically all the phytoplankton blooms 1999-2024, applying the methodology of Hobday et al. (2016) — the one used officially for marine heatwaves — adapted to phytoplankton: a bloom = at least 5 consecutive days above the 90th climatological percentile, for each of the 5 PFT groups (DIATO, DINO, CRYPTO, HAPTO, GREEN). The methodological detail, the annual charts by zone, the summary by group and the complete table of all the events (CSV) are in §12.5 of the BGC appendix.
NOTE ON THE SPATIAL SCALE: the count refers to 'areal' blooms over rectangular bounding boxes of 1,100-11,400 km² that include both the coastal strip and the adjacent open sea (1 km pixel resolution, the top 5-10 m of the water column). It does not correspond to 'blooms on beach X' but to 'episodes of exceedance of the 90th climatological percentile in the marine basin in front'. Point blooms of a few hundred metres are attenuated by the averaging; extensive and prolonged blooms emerge clearly, such as that of Pyramimonas. Detail in §12.5 BGC.
Salient results for the MASTER:
- 332 total blooms identified 1999-2024 over the 5 areas analysed (4 regional coasts + the Amantea-Lamezia focus).
- The NORTH IONIAN is the biologically most dynamic coast (120 blooms, ~4.6 per year); the TYRRHENIAN is by far the 'quietest' (39 blooms, ~1.5 per year), a third of the North Ionian. Consistent with the BGC picture: fewer nutrients, less chlorophyll, fewer blooms.
- The Pyramimonas case of 2024 at Amantea-Lamezia is confirmed: 5 summer events (4 CRYPTO + 1 DINO), the most intense at 3.43× the climatological threshold — the most extreme event for this zone in 26 years.
- 2024 was a biologically exceptional year on ALL the regional coasts: 6 of the 10 longest blooms of the 1999-2024 series are concentrated in 2024 (max 21 days on the southern Ionian).
- No monotonic increasing trend in blooms on any coast: high interannual variability, an alternation of quiet years and intense years, a climatic-natural pattern.
4.6 Summary of the ranking of factors
In the light of the whole analysis of Part II, the ranking of the factors that explain the differences between the four Calabrian coasts can be summarised as follows, in order of robustness of the evidence:
| Importance | Factor | Summary |
|---|---|---|
| 1st - solid | Bathymetry (South Ionian vs the others) | The South Ionian has a mean depth of 1,094 m (more than double the Tyrrhenian) and less than half the continental shelf. It robustly explains why Locri-Soverato-Catanzaro Marina is structurally less favourable to persistent stratification and therefore to mucilage. |
| 1st - solid | Currents of the Strait (Far South) | The Far South is the coast with the lowest summer SST (26.41 °C, vs the 27.31 of the Tyrrhenian). The mixing effect of the currents of the Strait of Messina, combined with an intermediate bathymetry (698 m), produces a measurable dynamic cooling. |
| 2nd - solid | Wind regime (Tyrrhenian vs South Ionian) | The Tyrrhenian has a constant weak wind (2.26 m/s in summer), the South Ionian is 55% windier (3.50 m/s). Independently confirmed by the Global Wind Atlas. It explains the Locri-Soverato vs Tyrrhenian difference jointly with bathymetry. |
| 3rd - hypothetical | Coastal configuration | The Tyrrhenian has 2 large semi-enclosed gulfs (Sant'Eufemia, Squillace); the Ionian has a more open coast with promontories (Capo Colonna, Capo Spartivento). It influences local stagnation but has not been directly quantified. |
| 4th - puzzling | North Ionian vs Tyrrhenian | The North Ionian has a bathymetry (441 m mean) and SST (26.91 °C in 2024) similar to or even more 'favourable' than the Tyrrhenian (494 m, 27.31 °C), yet mucilage reports seem fewer. Possible explanations: more dynamic currents (the Atlantic Ionian Stream), fewer reports due to lower tourism pressure, local specifics of the nutrients. To be investigated with specific ARPA observations. |
| 5th | Sea temperature in absolute value | The difference between the four coasts is < 0.9 °C in absolute value. It does not discriminate significantly between zones, but it is the driver of the overall trend: everywhere the situation worsens as the years go by. |
| 6th | Nutrient inputs | The North Ionian has the largest inputs (the Crati, the Neto, the Sibari plain) but is not the coast most affected: a confirmation that without the coincidence of calm + stratification, an abundance of nutrients alone is not enough. |
5. Ecological impacts of the warming
The warming of the sea does not manifest itself gradually, but through acute episodes (marine heatwaves) and structural changes (species regressions, tropicalisation, algal blooms). This chapter reviews the impacts documented at the Mediterranean level and how plausible they are for the Calabrian Tyrrhenian coast in the light of the data collected. The first topic — marine heatwaves — is analysed in detail on our data; the others are treated in the light of the specialist literature and of the thermal tolerance thresholds of the typical species.
5.1 Marine heatwaves (MHW): quantification on our data
Technical definition
A marine heatwave (MHW) is defined — according to the international convention of Hobday et al. (2016) — as a period of at least 5 consecutive days in which the SST exceeds the 90th climatological percentile, that is the value reached only on the 10% warmest days of the reference period (here 1991-2020). The climatology and the 90th-percentile threshold are computed day by day of the year and smoothed with an 11-day moving window to avoid artificial discontinuities.
MHW are the main mechanism through which the warming translates into ecosystem mortality: the stress does not come from the higher mean in itself, but from acute episodes of 1-4 weeks (or more) in which the temperature exceeds the physiological tolerance threshold of organisms and ecosystems. Hobday and colleagues also introduced a classification of MHW into four severity categories, as a function of how far the anomaly exceeds the difference between the 90th percentile and the climatology:
| Cat. | Name | Definition | Typical effect |
|---|---|---|---|
| I | Moderate | Anomaly between 1× and 2× the difference between the 90th percentile and the climatology | Noticeable but rarely lethal thermal stress |
| II | Strong | Anomaly between 2× and 3× the threshold-climatology difference | Significant physiological stress for sensitive species |
| III | Severe | Anomaly between 3× and 4× | Documented mortality of gorgonians, posidonia, sponges |
| IV | Extreme | Anomaly above 4× the threshold-climatology difference | Mass mortality events, coral bleaching, profound alterations |
Results of the MHW analysis on the Amantea-Lamezia stretch
Applying the Hobday methodology to our 1982-2025 series for the Amantea-Lamezia stretch, 120 distinct MHW events were identified. Their distribution over time, their annual frequency and their intensity are shown in Figure 5.1.
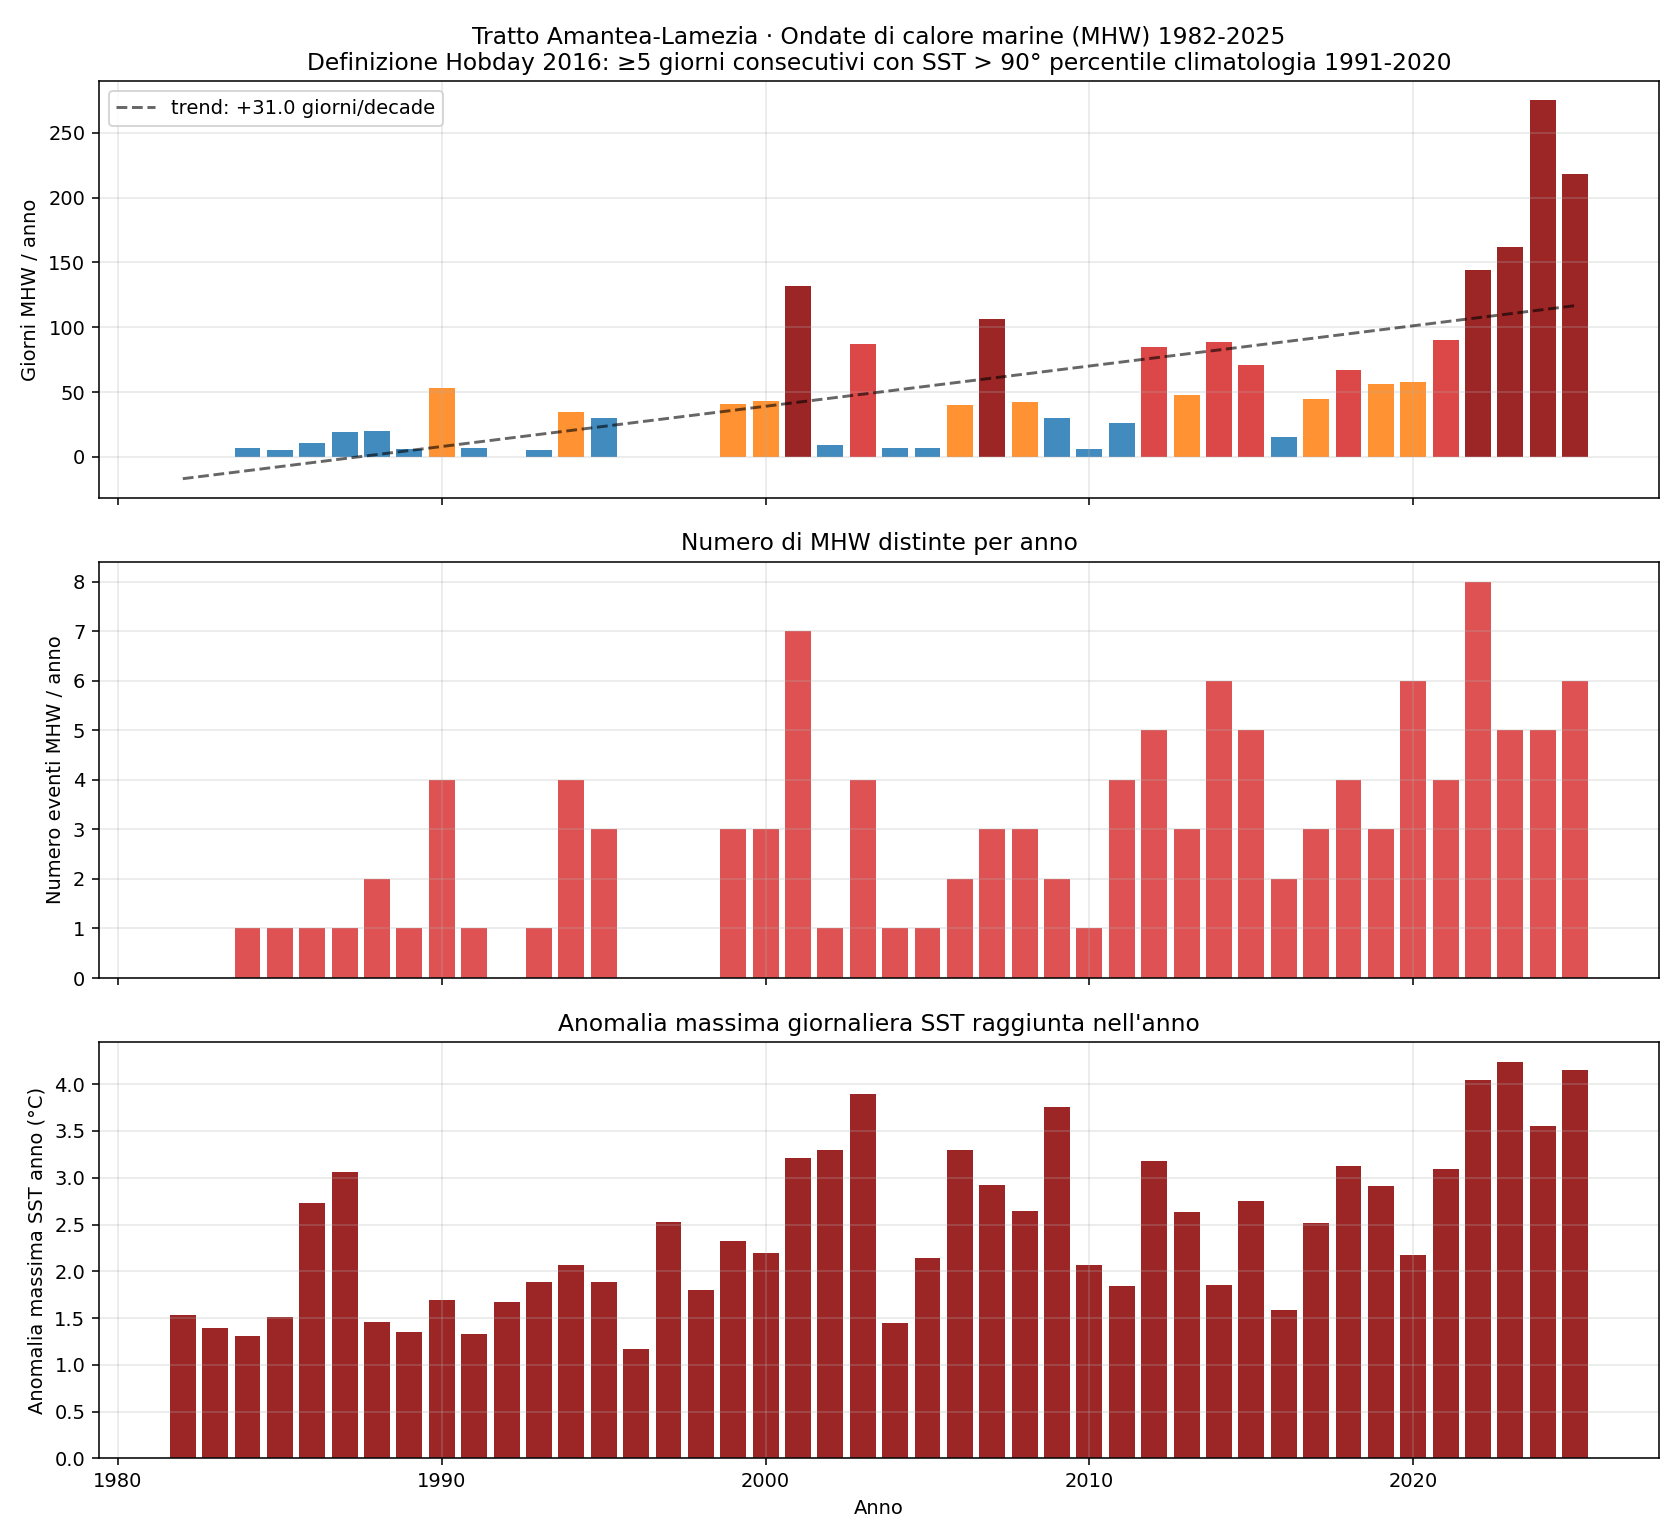
Figure 5.1 — Marine heatwaves (MHW) on the Amantea-Lamezia stretch, 1982-2025. Upper panel: total MHW days per year (blue = 0-30 days, orange = 30-60, red = 60-90, dark red >90); dashed line = linear trend. Central panel: number of distinct MHW events per year. Lower panel: maximum daily anomaly reached in the year (°C above the climatology).
How to 'see' a marine heatwave: the anatomy of 2024
For those unfamiliar with the technical definition, Figure 5.2 is the most intuitive way to understand what an MHW is. On the same chart three curves referring to the Amantea-Lamezia stretch are plotted:
- Blue line: the mean daily climatology 1991-2020 — that is, the 'expected temperature' of the sea on each day of the year, computed over the 30-year reference period.
- Orange dashed line: the 90th-percentile threshold — the value that historically was exceeded only on the 10% warmest days. When the daily SST exceeds this line, we are formally in an MHW state (provided the exceedance lasts ≥5 days).
- Dark red line: the daily SST actually observed in 2024.
The areas coloured red highlight the days on which the sea went above the MHW threshold. Very few days of 2024 were NOT in this condition.
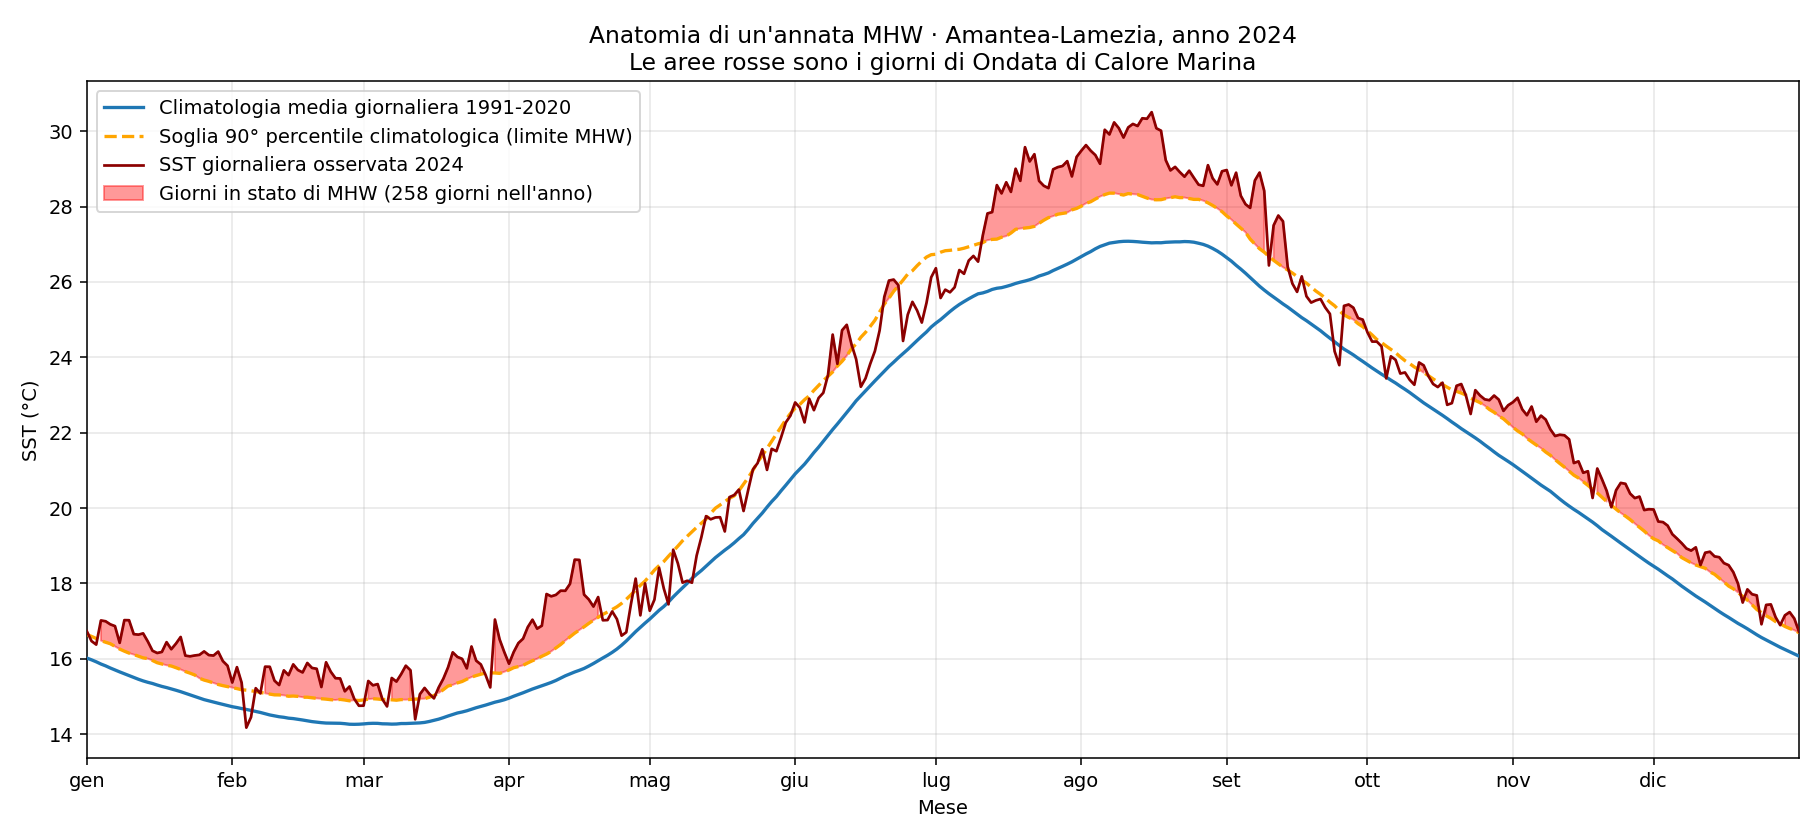
Figure 5.2 — Anatomy of the year 2024 on the Amantea-Lamezia stretch. The blue curve is the expected climatology, the orange dashed one is the 90th-percentile threshold (the upper limit of the 'climate normal'), the dark red one is the SST observed in 2024. The areas coloured red are the days on which the SST exceeded the threshold: visually they represent the 'amount of heatwave' the sea underwent.
The chart clarifies a central point: an MHW is not a one-off event, it is a condition the sea passes through for long periods. In 2024 the SST was practically always above the climatology (the red line almost always above the blue line), and for most of the year also above the 90th-percentile threshold. The summer (June-September) shows a peak with SST up to above 30 °C, well above the expected threshold of ~28 °C. But the striking figure is the persistence of the anomaly in autumn and winter too — a sign that the thermal imbalance is chronic, not episodic.
Monthly distribution of the MHW: a panoramic view over 44 years
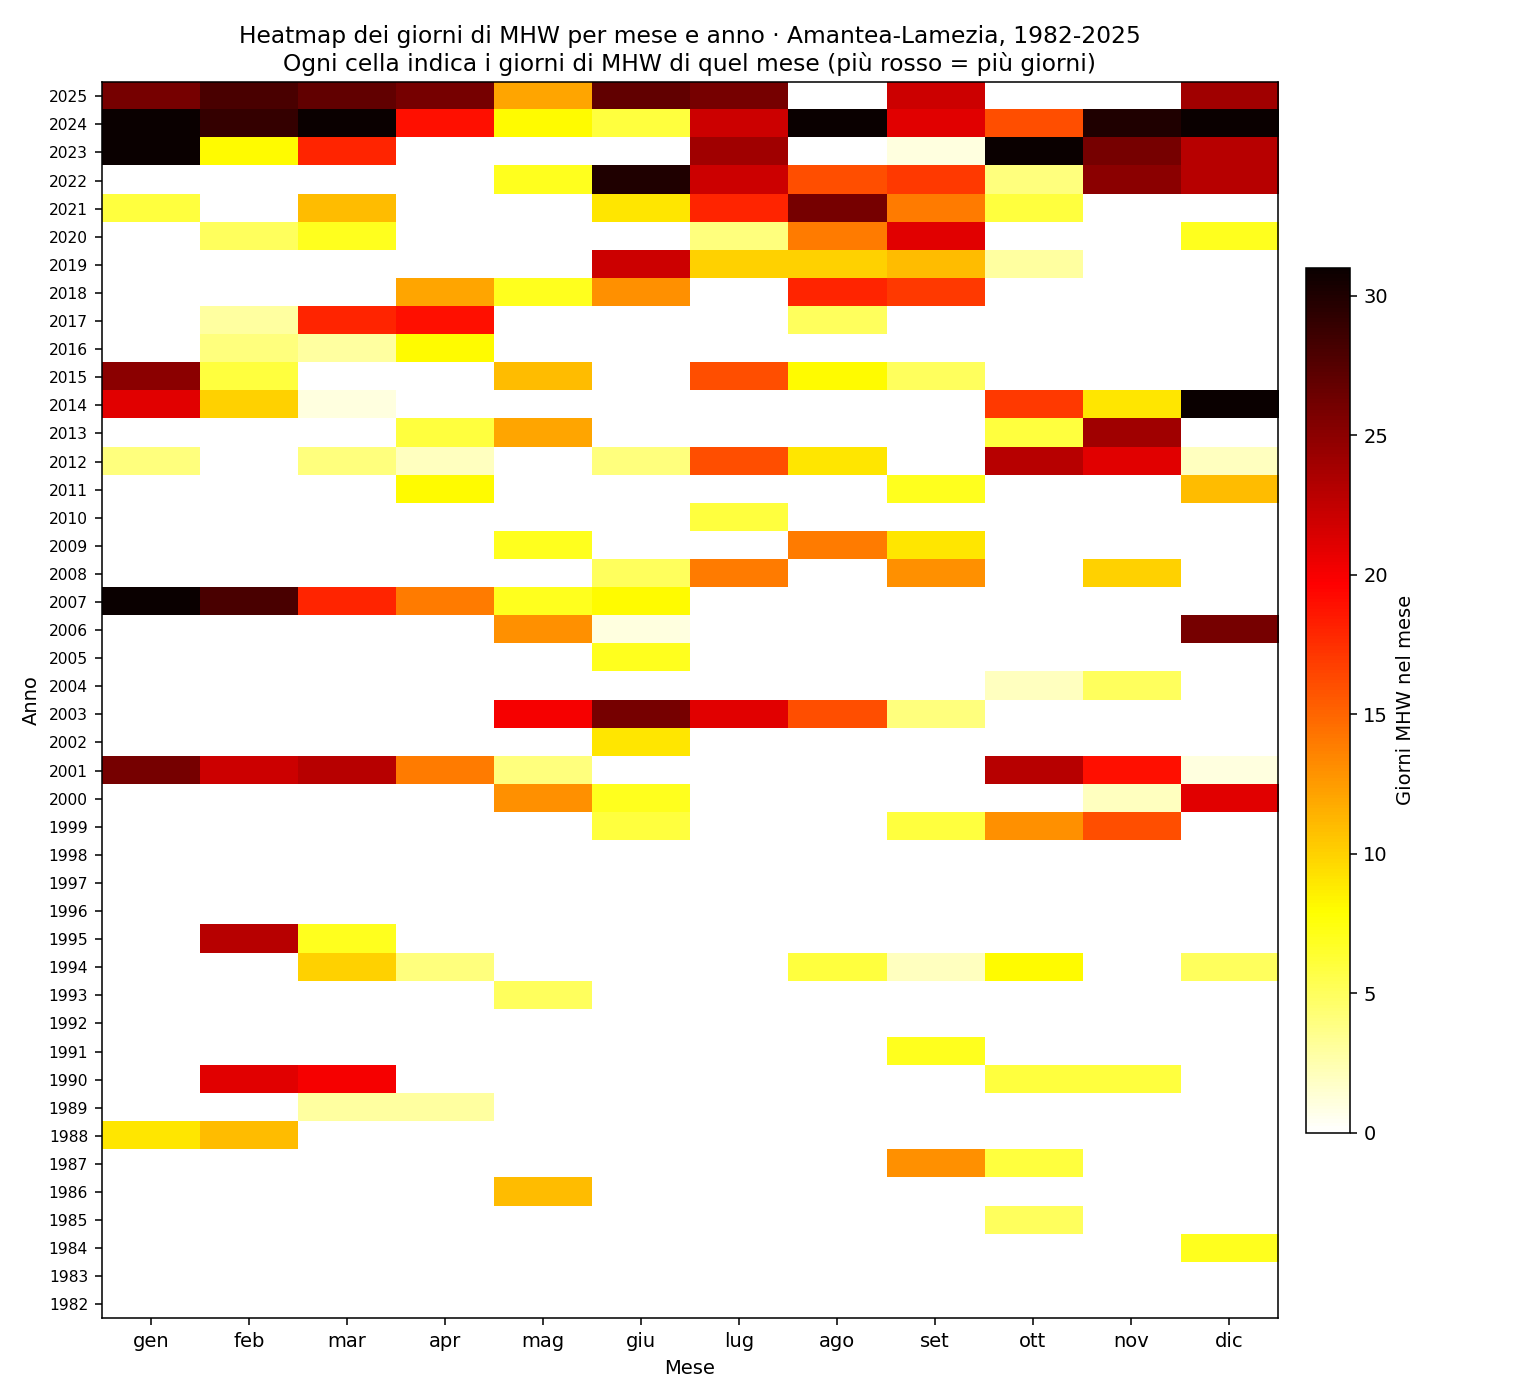
Figure 5.3 — Heatmap of MHW days per month and year, 1982-2025, on the Amantea-Lamezia stretch. y-axis: year (2025 at the top, 1982 at the bottom). x-axis: months from January to December. Cell colour: number of MHW days in that month (white = 0, black = 31, continuous scale).
The heatmap reveals four phenomena that the tables and annual charts cannot show with the same immediacy:
- Vertical expansion of the phenomenon: in the first 14 years (1982-1995) the chart is almost entirely white, a sign that MHW were sporadic and short. From 1998 onwards the number of coloured cells grows conspicuously. From 2017 onwards, all the rows have dark cells in several months.
- Seasonal widening: in the past decades the rare MHW were concentrated in June-September. Today the MHW cover practically all the months of the year: December 2023, January-February 2024 and 2025 have very dark cells, indicating almost continuous winter MHW.
- Special historical years: 2003 (the European heatwave) is clearly visible as a red band concentrated in May-August. 2001 stands out for the MHW at the start of the year. 2007 for January-February.
- The 'wall' of the recent years: 2022, 2023, 2024, 2025 show horizontal rows of almost solid colour — a qualitatively new situation in the historical series.
How much the climatology has shifted in 25 years
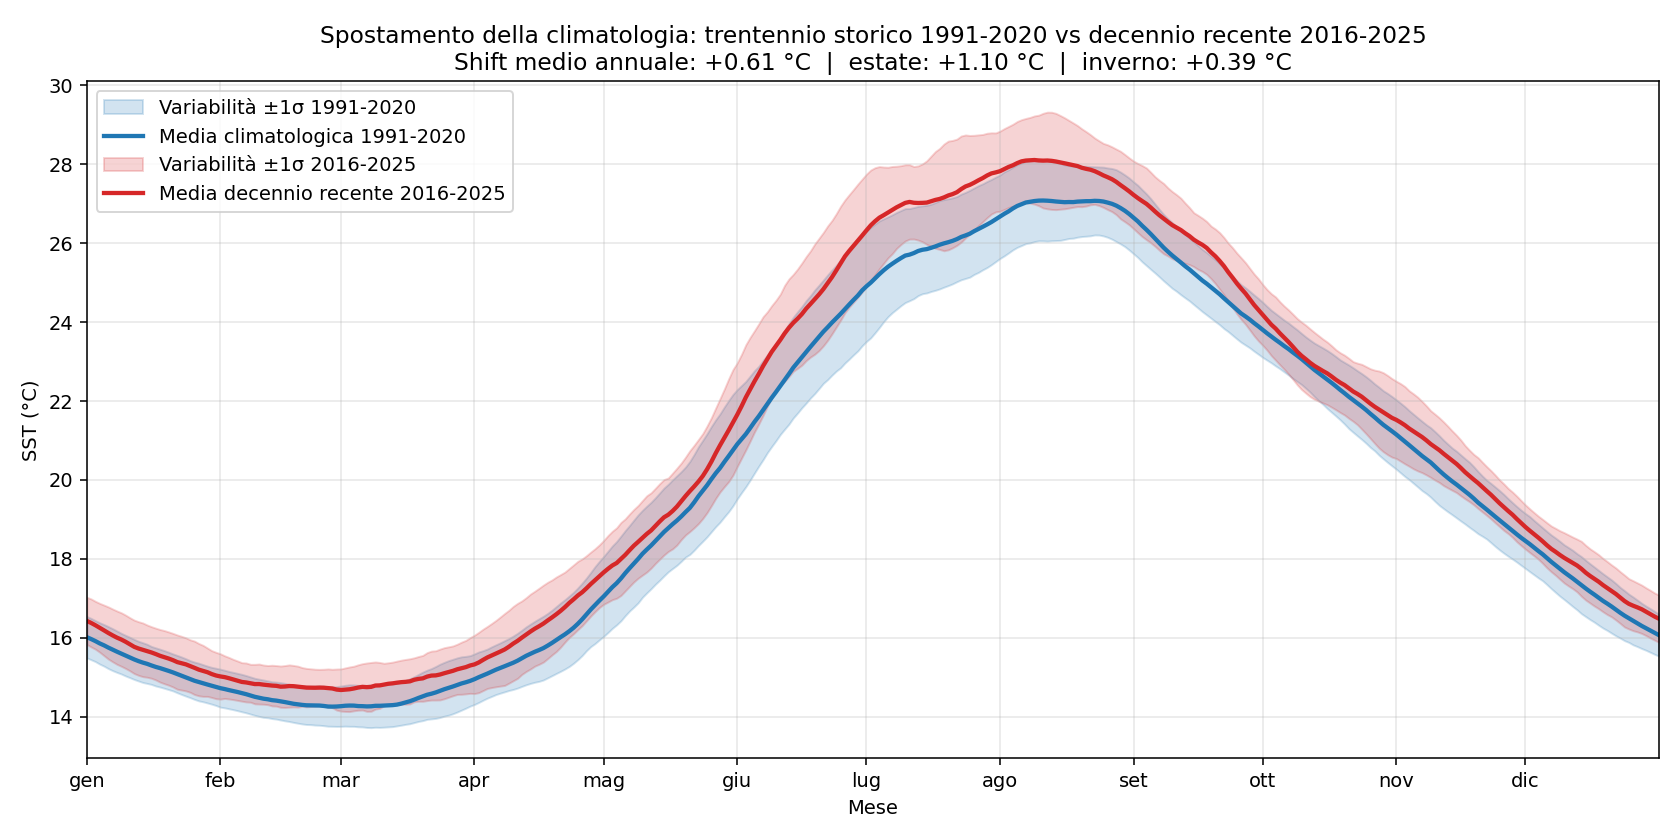
Figure 5.4 — Shift of the annual climatology between the historical 30-year period 1991-2020 (blue) and the recent decade 2016-2025 (red). The light band around each line represents the typical variability (±1 daily standard deviation). The chart title reports the mean annual shift (+0.61 °C), the summer shift (+1.10 °C) and the winter shift (+0.39 °C).
The difference between the two curves quantifies the mean warming: +0.61 °C in 25 years on the annual mean, but +1.10 °C in summer (with peaks of +1.5 °C in late July - early August). Winter has warmed less (+0.39 °C) but significantly, especially in February-March. An important detail should be stressed: the red ±1σ band of the recent decade lies largely ABOVE the blue band of the historical 30-year period. This means that the 'normal' years of 2016-2025 are already warmer than the 'extreme' years of 1991-2020 — it is no longer a comparison between exceptions but between different normals.
Historical accumulation of MHW days
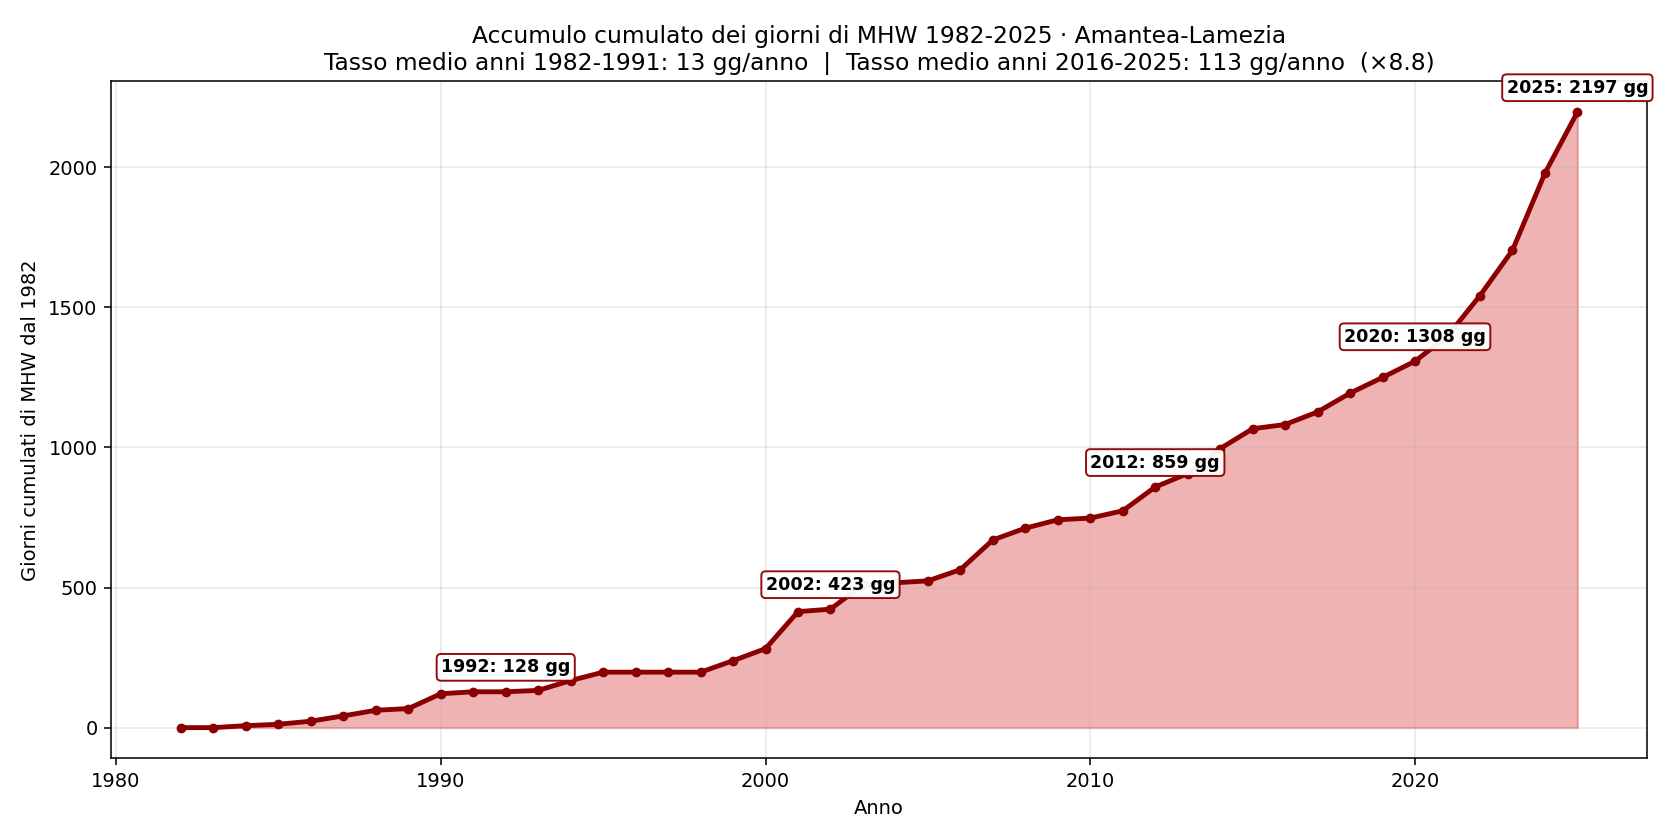
Figure 5.5 — Cumulative MHW days from 1982 to 2025. The y-axis shows the progressive total of MHW days accumulated since the start of the series. The chart title reports the mean annual rate of the first 10 years (13 days/year) and of the last 10 years (113 days/year), with the growth ratio.
The figures are eloquent:
- Mean rate 1982-1991: 13 MHW days per year (a 'physiological' situation).
- Mean rate 2016-2025: 113 MHW days per year (an abrupt acceleration).
- An increase by a factor of 8.8: today's MHW are almost 9 times more frequent than those of the early years of the series.
The inflection of the curve is particularly marked after 2020: in just 5 years (2020-2025) about 890 MHW days were accumulated, against 1,300 days accumulated in the 38 preceding years. It is the numerical signal that the phenomenon is not only increasing but is accelerating further.
The data of the last 5 seasons in detail:
| Year | MHW days | No. of events | Max anom. (°C) | Max category |
|---|---|---|---|---|
| 2021 | 90 | 4 | +3.09 | II - Strong |
| 2022 | 144 | 8 | +4.04 | III - Severe |
| 2023 | 162 | 5 | +4.24 | II - Strong |
| 2024 | 275 | 5 | +3.55 | III - Severe |
| 2025 | 218 | 6 | +4.15 | II - Strong |
The 2024 figure (275 MHW days out of 366) means that the sea spent 75% of the year in a heatwave state. To give a reference scale: no year of the series before 2020 exceeded 132 days; many years are below 30 days. The computed linear trend is +31 MHW days per decade. Over 44 years this means a total increase of about 135 days — in the past almost the whole year was 'thermally normal', whereas today a growing portion of the year is in a state of persistent anomaly.
Top longest events of the series
A new characteristic of the recent years is the formation of winter and trans-seasonal MHW, never observed before in the series. The longest events of the historical series are:
| # | Period | Duration | Max anom. | Cat. | Notes |
|---|---|---|---|---|---|
| 1 | 23 Dec 2023 → 19 Apr 2024 | 119 days | +2.98 °C | II - Strong | Winter-spring MHW (never observed before) |
| 2 | 6 Dec 2006 → 18 Mar 2007 | 103 days | +1.65 °C | II - Strong | Generalised mild winter |
| 3 | 16 Oct 2024 → 14 Jan 2025 | 91 days | +1.90 °C | II - Strong | The pattern of a sea 'that does not cool down' continues |
| 4 | 10 Jul → 16 Sep 2024 | 69 days | +3.55 °C | III - Severe | The 2024 summer MHW: the most severe in peak intensity |
| 5 | 9 Dec 2022 → 8 Feb 2023 | 62 days | +2.00 °C | III - Severe | Anomalous winter 2022/23 |
| 6 | 20 Jan → 21 Mar 2025 | 61 days | +1.87 °C | II - Strong | Confirmation of the recent winter pattern |
| 7 | 30 Sep → 26 Nov 2023 | 58 days | +2.39 °C | II - Strong | Warm autumn 2023 |
| 8 | 4 Jun → 26 Jul 2025 | 53 days | +4.15 °C | II - Strong | Peak of the seasonal anomaly of 2025 |
The most relevant novelty is that the longest events of the series are not the summer ones (as one might instinctively think) but the winter ones. A winter sea and atmosphere 'too warm relative to the winter normal' for consecutive months. This pattern, unknown until 2006, is today almost annual since 2022.
Implications of the winter and trans-seasonal MHW:
- A lack of thermal rest for the water column: the summer stratification does not break down completely, and in spring it restarts from a warmer baseline.
- An altered reproductive cycle for fish species (sardines, anchovies): the trigger temperature of spawning is reached at anomalous times.
- Possible winter survival of thermophilic alien species that in the past did not withstand the Mediterranean winter.
- Prolonged stress on benthic organisms: instead of an acute summer episode followed by recovery, an almost-continuous stress takes shape.
Thermal-stress thresholds for the typical species
To give biological meaning to the observed MHW, we report the thermal tolerance thresholds documented in the literature for the sensitive species of the Calabrian Tyrrhenian coast:
| Species | Stress threshold | Mortality threshold | Effect |
|---|---|---|---|
| Posidonia oceanica | 26 °C | 28 °C | Prolonged stress → rhizome necrosis → meadow regression |
| Paramuricea clavata (red gorgonian) | 23-24 °C | 25 °C for >2 weeks | Mass mortality, episodes in 1999, 2003, 2022 |
| Eunicella spp. (yellow gorgonians) | 24-25 °C | 26 °C | Tissue necrosis, loss of skeleton |
| Spongia officinalis (sponges) | 25 °C | 26 °C prolonged | Widespread summer mortality |
Comparing with our figures: a summer MHW of Category III such as that of July-September 2024 (maximum anomaly +3.55 °C) developed on a summer baseline already at 26-27 °C — this means that during the event the warmest pixels of the box touched and exceeded 30 °C daily, well within the mortality range for gorgonians and posidonia.
5.2 Posidonia oceanica and underwater meadows
Posidonia oceanica is a marine plant endemic to the Mediterranean (not an alga: it is a seagrass, similar to land plants, with roots, rhizomes and leaves). Its underwater meadows are protected at the European level for their key ecological role: they oxygenate the water, stabilise the seabed, host fish nurseries and sequester carbon.
Prolonged summer thermal stress compromises the photosynthesis and growth of this species. The symptoms of heat-related decline include: a reduction in the density of the leaf shoots, anomalous flowering (posidonia flowers under acute stress), rhizome necrosis, and a regression of the lower limit of the meadow at depth.
The Amantea-Lamezia stretch hosts historical posidonia meadows, especially off Falerna Marina, Nocera Terinese, Gizzeria Lido and Lamezia Marinella. The regression of the meadows of the Gulf of Sant'Eufemia has been under observation for about 15 years. It is plausible — in the light of our data — that the combination of thermal stress (summer SST 2 °C above the norm) and local human pressures (anchoring, discharges, eutrophication) is accelerating this decline.
5.3 Gorgonians, corals and benthic fauna
Gorgonians are branching cnidarians that colonise submerged rock walls. Species typical of the Calabrian Tyrrhenian coast: Paramuricea clavata (red gorgonian, depth 20-50 m), Eunicella cavolini (yellow), Eunicella singularis (white). They are ecological indicators sensitive to thermal stress.
Mass mortality events documented in the western Mediterranean:
| Year | Area | Notes |
|---|---|---|
| 1999 | Liguria-Provence | The first large documented event, ~60% mortality below 25 m |
| 2003 | NW Mediterranean | Concurrent with the European atmospheric heatwave |
| 2018-2019 | Southern Tyrrhenian, Sicily | Documented on Calabrian stretches too |
| 2022 | The whole NW Mediterranean | Considered the most serious of the last 25 years |
| 2024 | The whole Mediterranean | Record anomalies, assessments ongoing (T-MEDNet network) |
The gorgonian walls of Capo Suvero, Capo Vaticano and Tropea represent, for many species, the southern limit of distribution. Under the current thermal regime, the depth of the 'thermal refuge' (below the thermocline) is shifting downwards: populations that 30 years ago lived stably at 25 m are today stressed in summer, and must move to 40-50 m to find compatible temperatures.
5.4 Harmful algal blooms (HAB)
HAB (Harmful Algal Blooms) are explosive proliferations of phytoplankton species that produce harmful effects. The main one relevant to the Calabrian Tyrrhenian coast is Ostreopsis ovata: a benthic dinoflagellate microalga that produces palytoxin (PLTX) and ovatoxins. It is the most relevant HAB for the Italian Tyrrhenian, under systematic surveillance by ARPA Calabria.
- Optimal conditions: SST 25-28 °C, a calm sea, rocky or pebbly seabeds.
- Effect on humans: a respiratory-irritative syndrome (eyes, nose, throat, airways) transmitted by marine aerosol; no intoxication from direct contact or from the ingestion of fish.
- Historical case: the Genoa bloom of 2005, over 200 people with acute symptoms, emergency-room admissions.
- Trend: the number and intensity of the events have clearly increased since 2005, with a robust correlation with high summer SST.
Other relevant HAB: Pseudo-nitzschia (diatoms that produce domoic acid, ASP - Amnesic Shellfish Poisoning) and Alexandrium (dinoflagellates that produce saxitoxins, PSP - Paralytic Shellfish Poisoning). Sporadic episodes in the southern Tyrrhenian, with possible temporary bans on the harvesting of bivalve molluscs.
5.5 Tropicalisation of the Mediterranean
With summer SST now at levels typical of North African seas, the establishment of thermophilic species (originating from warmer seas) is now a reality. Species already observed or expected in the Calabrian Tyrrhenian:
| Species | Type | Origin | Status in Calabria |
|---|---|---|---|
| Caulerpa cylindracea | green alga | Australia | Established and expanding |
| Siganus luridus / S. rivulatus | rabbitfish | Red Sea (Lessepsian) | Sporadic sightings |
| Fistularia commersonii | bluespotted cornetfish | Indo-Pacific | Documented along the whole coast |
| Pterois miles | devil firefish (lionfish) | Red Sea | Active expansion from Sicily |
| Rhopilema nomadica | jellyfish | Indo-Pacific | Sightings increasing |
| Saurida lessepsianus | lizardfish | Red Sea | Expected in the short term |
5.6 Fishing and commercial fish fauna
The thermal changes also have direct effects on species of commercial importance for Calabrian fishing (Pizzo, Vibo, Cetraro, Diamante):
- Sardines, anchovies, mackerel (small pelagics): the thermal window favourable to reproduction is compressed, with possible structural declines (already documented in the Adriatic).
- Prized oily fish (bonito, mahi-mahi): a shift of the shoals towards the north or towards greater depths.
- Cephalopods (octopus, squid): less thermally sensitive, with a possible relative advantage in the new condition.
- Bluefin tuna: paradoxically, the warmer waters extend the favourable thermal window — one of the few 'winners' of the transition.
PART III
The coastal waters
6. Mucilage preconditions on the Amantea-Lamezia stretch
This chapter goes into detail on the phenomenon with the greatest practical relevance for the tourism sector and for the public perception of sea quality: summer mucilage. The chapter combines a description of the phenomenon with a quantitative analysis of its thermal precursors in the 1982-2025 data, and proposes an operational calendar for the operators of the Amantea-Lamezia stretch.
6.1 What mucilage is and why it is a nuisance
Contrary to what the term 'algal blooms', often used by the press, suggests, mucilage is not an alga. It is a gelatinous mass of a polysaccharide nature — a kind of 'transparent or slightly amber biological glue' — produced by phytoplankton under stress (heat, a calm sea, a scarcity of nutrients relative to the biomass). From a chemical point of view it is an aggregate of extracellular polysaccharides (EPS) that organise themselves into transparent gelatinous particles (TEP, Transparent Exopolymer Particles) which in turn aggregate into macroscopic formations.
The species involved in the southern Tyrrhenian include:
- Chrysophaeum taylorii — a golden alga, frequent on the Calabrian and Sicilian Tyrrhenian coast.
- Aphanocapsa marina — a cyanobacterium of the warm Mediterranean seas.
- Gonyaulax fragilis — a dinoflagellate, more typical of the Adriatic.
Tourism impact: the visible sequence
The critical aspect for operators is that the phenomenon has several stages of visibility, each with a different effect on the tourist's perception. Even early stages, not serious in ecological terms, can produce reputational damage via social media:
| Stage | Appearance | Effect |
|---|---|---|
| Pelagic filaments | Whitish/yellowish strings, 10-50 cm, suspended in water | Visible while diving, perceived as 'suspended dirt' by bathers |
| Floating aggregates | Floating yellow-brown gelatinous patches, up to 50 cm | Photographable, the first element that 'makes the news' on social media |
| Surface foam | Persistent, brown foam along the shoreline | The worst appearance for the tourist; beaches perceived as dirty |
| Deposit on the shoreline | A brown gelatinous blanket, decaying and foul-smelling | Beach clubs must clean repeatedly, a prolonged drop in attendance |
| Underwater 'carpet' | A brown veil adhering to the bottom, on posidonia or rocks | Smothering of posidonia and gorgonians, a reduction in catch |
A critical point for communication: the reputational damage is out of phase with the real phenomenon. A viral photograph in July can compromise the bookings of the whole summer, even after the sea has cleared. For this reason it is important to anticipate any possible event narratively.
6.2 Why they form: the biological mechanics
The mechanism is well understood at the scientific level. Under normal conditions (a sea well mixed by the wind, a turbulent spring), phytoplankton is balanced: nutrients from the bottom flow up to the surface, the biomass is controlled by turbulence, and the exopolymers produced are dispersed.
When the sea stratifies thermally (typical of summer), everything changes:
- The surface layer (the first 10-30 m) 'isolates' itself from the rest: the warm water floats above the cold deep water and the two layers no longer mix.
- The surface layer becomes poor in nutrients (oligotrophic): the nitrogen and phosphorus that arrived with the spring river floods have already been consumed, and the deep ones do not rise.
- The phytoplankton cells enter a state of stress: they have abundant light but scarce food, a condition of metabolic imbalance.
- Under stress, instead of growing and dividing, the cells release extracellular polysaccharides (EPS) as a defence mechanism.
- In calm water (weak wind, an oily sea), these polymers do not disperse but aggregate into TEP, then into flocs, then into macroscopic masses — the mucilage.
- A few days of weak wind are enough to accumulate the mucilage at the surface or along the shoreline.
6.3 The four triggering factors
The formation of mucilage requires the temporal coincidence of four conditions. SST is the first and the easiest to monitor, but on its own it is not enough:
| Factor | What is needed | What we can measure |
|---|---|---|
| Thermal | SST > 22 °C early, stable stratification for several weeks | ✓ Measurable via satellite (Part II) |
| Mechanical | A calm sea for >10-15 consecutive days, weak wind | ✓ Measurable via Copernicus Wind (Part II Ch. 4) |
| Nutritive | An input of nitrogen and phosphorus in the preceding months (rain, discharges, rivers) | ✗ Requires specific ARPA data and discharge monitoring |
| Biological | A predisposed phytoplankton community, the absence of predators | ✗ Requires direct sampling and microscopy |
Operational conclusion: SST counts as a 'permit to happen'. If the thermal indicator is high but the other three factors do not align, the event may not occur. But if the SST is low, the event is mechanically impossible. For the Amantea-Lamezia stretch we can therefore reliably monitor the first two factors (SST and wind) and consider their state as an 'enabling condition' for mucilage.
6.4 The analysis: 44 years of thermal precursors (Amantea-Lamezia)
On the basis of the daily SST data 1982-2025 for the Amantea-Lamezia stretch, four indicators specific to the mucilage precursor preconditions were computed:
| Indicator | Meaning |
|---|---|
| Mean May SST | The anticipation of stratification: if May is already warm, the summer starts with the thermocline already formed. |
| Day of year (doy) of the first exceedance of 22 °C | When the window of favourable conditions 'opens': the earlier, the longer the vulnerable season. |
| Days in the critical 24-28 °C window | The duration of the thermal window in which mucilage typically proliferates. |
| Days with SST ≥ 25 °C | A general indicator of marked summer stratification. |
All the indicators were combined into a composite precondition index (scale 0-100), weighted to give more importance to the earliness of stratification (30%) and to the duration of the critical window (30%), and less to the May SST (25%) and to the days above 25 °C (15%).
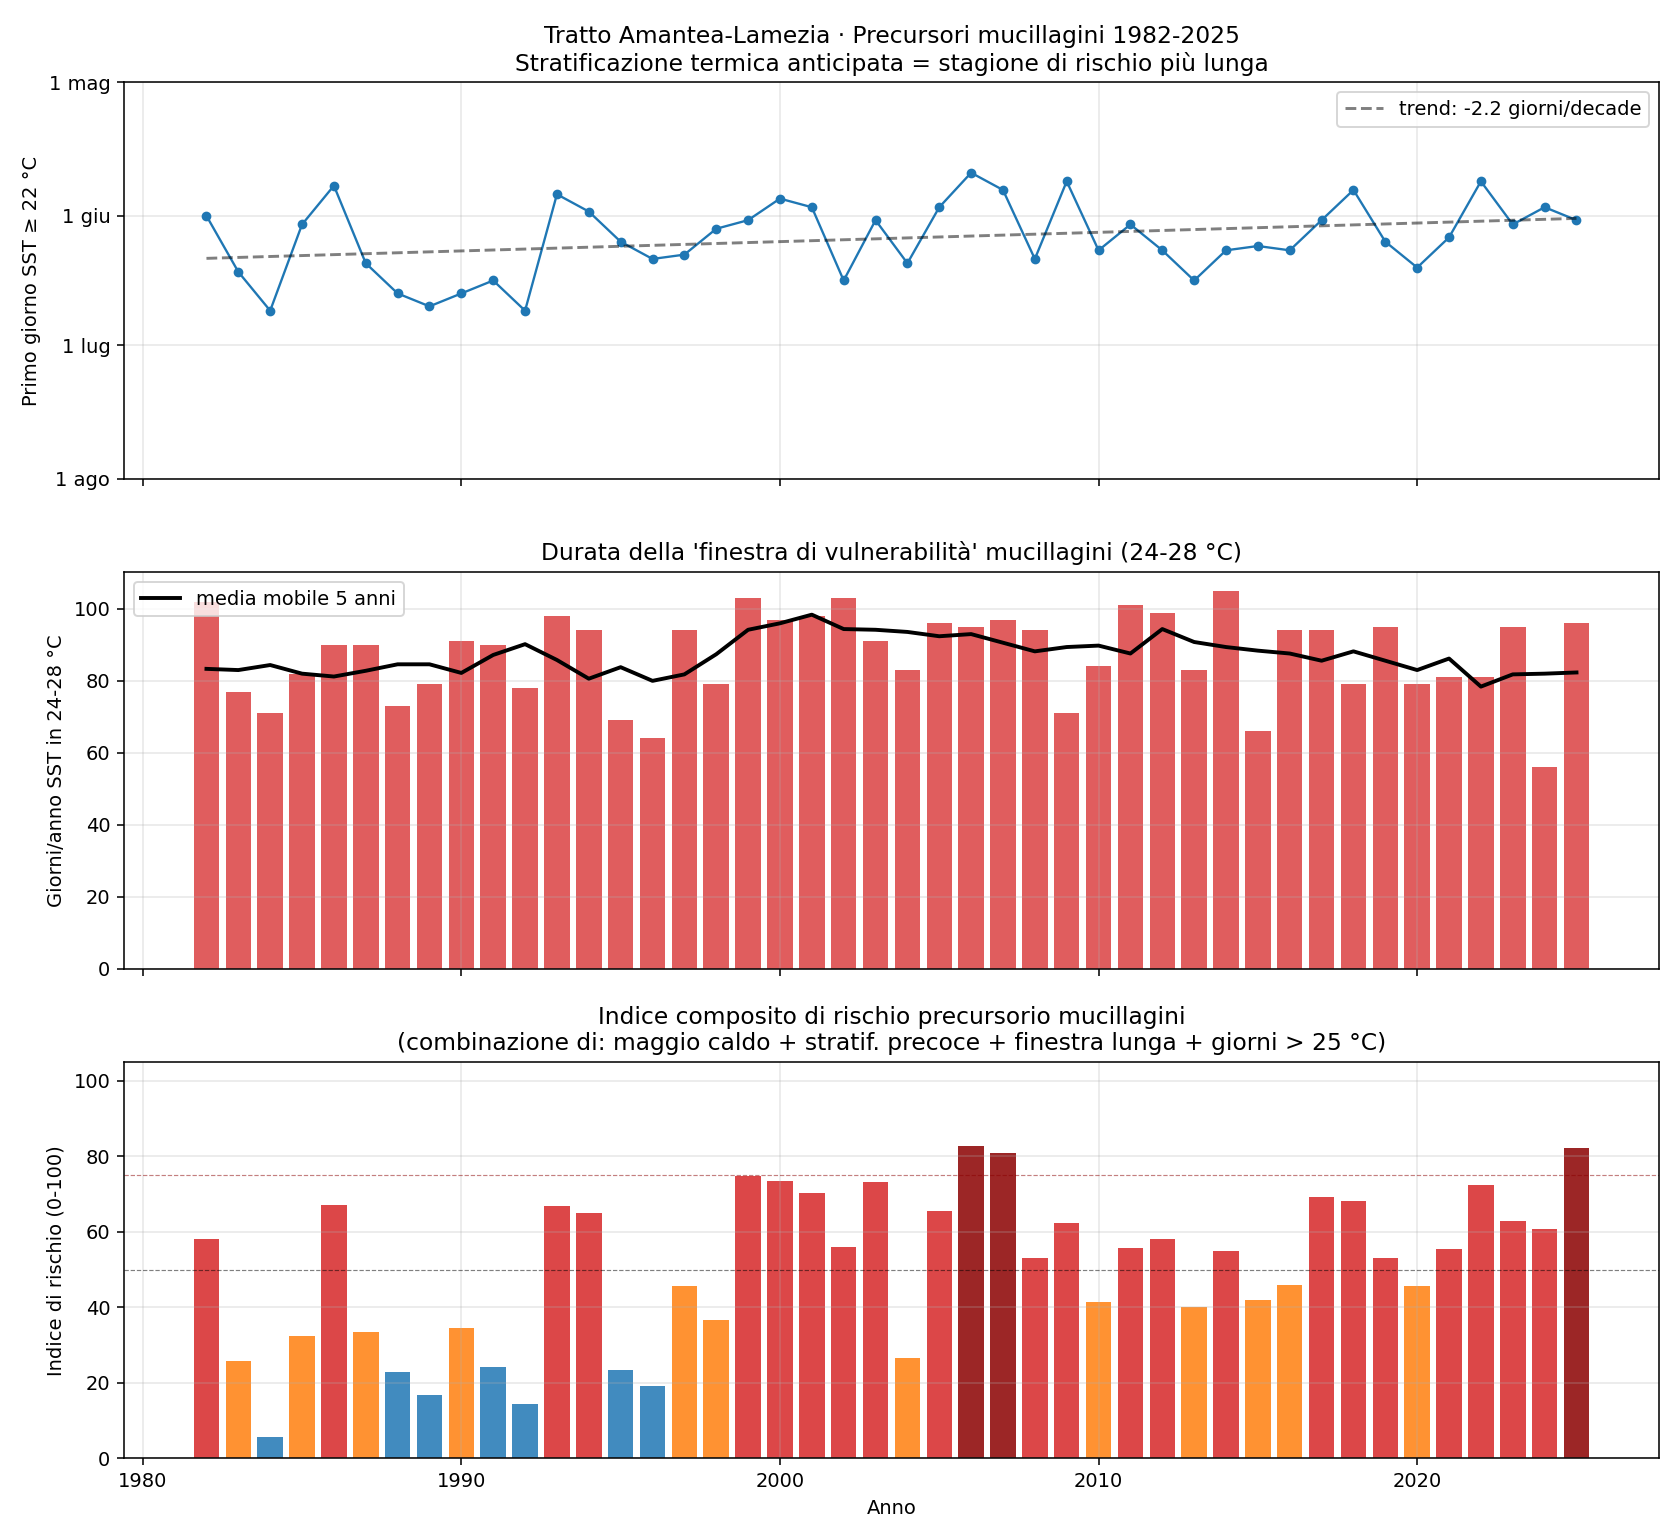
Figure 6.1 — Mucilage-precursor indicators on the Amantea-Lamezia stretch, 1982-2025. Upper panel: day of the year of the first exceedance of 22 °C (inverted axis: higher = earlier = worse). Central panel: number of days/year in the 24-28 °C thermal window (with a 5-year moving average in black). Lower panel: composite precondition index (0-100), bars coloured by level band.
How to read the chart
The upper panel shows a clear tendency: the day on which the SST reaches 22 °C — the typical threshold for the onset of stratification — has moved earlier by 2.2 days every decade. In the 1980s this happened on average towards the end of June; today it typically happens in the first week of June. That is 10-15 days less of cool 'pre-season', that is, that many more days of the vulnerable season.
The central panel shows that the number of days in the critical 24-28 °C window has grown: the moving average (black line) has gone from about 80 days/year in the 1980s to over 90 days/year in the last decade, with annual peaks up to 100-103 days.
The lower panel — the composite index — visually identifies the years most exposed from the thermal point of view. The dark-red bars (index ≥75) are few years: 2006, 2007, 2025. The red bars (50-75) are many, especially after 2015. The blue bars (a low index) have practically disappeared after 2015.
Top 5 years by precursor preconditions
Combining the four indicators in the composite index, the years with thermal conditions most favourable to mucilage formation on the Amantea-Lamezia stretch turn out to be:
| Pos. | Year | May anom. | 1st day ≥22°C | Days 24-28°C | Days ≥25°C | Index |
|---|---|---|---|---|---|---|
| 1 | 2006 | +1.15 °C | 22 May | 95 | 74 | 82.8 |
| 2 | 2025 | +1.35 °C (record) | 2 June | 96 | 111 (record) | 82.3 |
| 3 | 2007 | +0.94 °C | 26 May | 97 | 76 | 80.9 |
| 4 | 1999 | +0.44 °C | 2 June | 103 | 78 | 74.8 |
| 5 | 2000 | +1.01 °C | 28 May | 97 | 56 | 73.5 |
| — | 2022 | +0.68 °C | 24 May | 81 | 105 | 72.4 |
| — | 2018 | +1.07 °C | 26 May | 79 | 85 | 68.1 |
It should be stressed that 2022 — a notoriously difficult year for the Mediterranean — drops out of the top 5 of the precursor index because the SST exploded beyond 28 °C, leaving the 'optimal' mucilage window (24-28 °C). In that case mucilage events in the Calabrian Tyrrhenian still occurred, a sign that at a certain point the SST becomes so high that it goes beyond the mucilage window, while in the meantime massive thermal stresses take place.
6.5 The 3-factor composite index (with biogeochemical data)
The old precursor index, presented in §6.4, combined only two of the three triggering factors of mucilage: the thermal one (May SST, earliness of stratification, duration of the critical window) and, implicitly, the mechanical one (attributable to the duration of the thermal window itself, because wind enters into the surface-wind data analysed in Ch. 4). The third factor was missing: nutrients. Thanks to the Copernicus biogeochemical data presented in §4.5 it is now possible to close the triangle.
The new 3-factor composite index for the Amantea-Lamezia stretch combines two normalised components (percentile rank 0-100):
- Thermal component: 40% mean May SST + 30% earliness of the first day ≥22 °C + 30% days in the critical 24-28 °C window. It is the same component as the old index.
- Nutritive component: 50% mean July-August NPP + 50% pre-season N:P ratio May-Jun. It measures how much phytoplankton is produced in the surface layer and how imbalanced the N/P ratio is (an indicator of stress from phosphorus limitation).
The final composite index is the mean of the two with 50/50 weights. The time horizon is 1999-2024 (the limit of the MedBFM dataset).
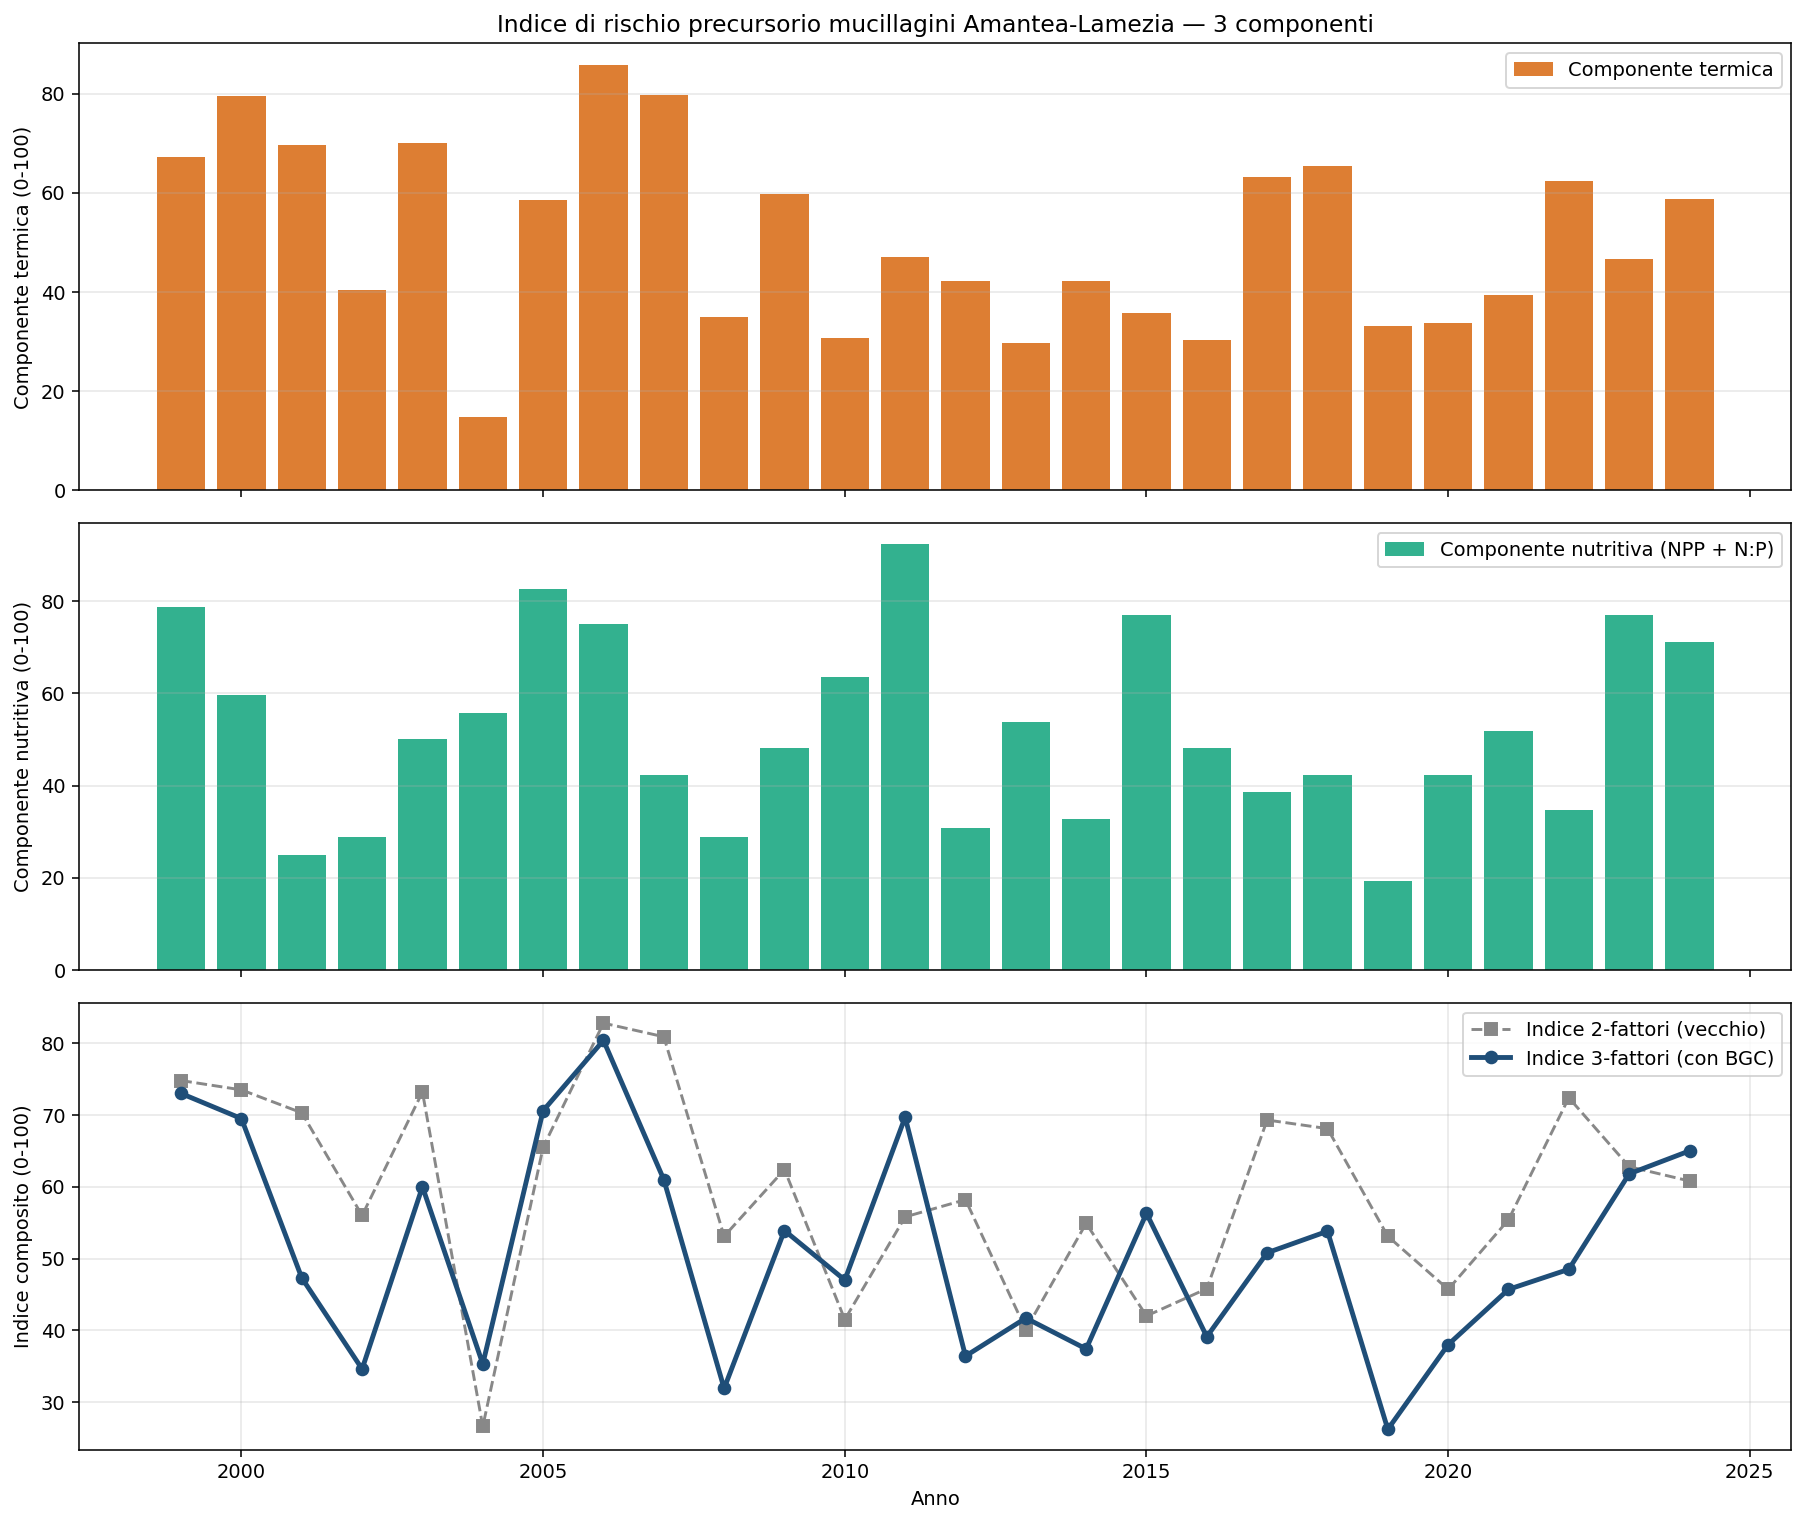
Figure 6.3 — Mucilage precursor precondition index for Amantea-Lamezia over 3 components. Panel 1: thermal component (percentile rank 0-100). Panel 2: nutritive component (NPP + N:P, from MedBFM). Panel 3: comparison of the old 2-factor index (grey) vs the new 3-factor index (blue). Years can be seen in which the 3F index rises or falls significantly relative to the previous one.
Top 10 years by precursor preconditions (3-factor index)
| Pos. | Year | Thermal comp. | Nutritive comp. | 3F index | 2F index (old) | Reading |
|---|---|---|---|---|---|---|
| 1 | 2006 | 85.8 | 75.0 | 80.4 | 82.8 | 1st place confirmed |
| 2 | 1999 | 67.1 | 78.8 | 73.0 | 74.8 | Confirmed |
| 3 | 2005 | 58.5 | 82.7 | 70.6 | 65.5 | Promoted (was 7th) |
| 4 | 2011 | 47.1 | 92.3 | 69.7 | 55.8 | A decisive promotion: a 'nutritive bomb' invisible to the old index |
| 5 | 2000 | 79.4 | 59.6 | 69.5 | 73.5 | Confirmed |
| 6 | 2024 | 58.8 | 71.2 | 65.0 | 60.8 | Strong recent preconditions |
| 7 | 2023 | 46.7 | 76.9 | 61.8 | 62.8 | Stable, high N:P |
| 8 | 2007 | 79.6 | 42.3 | 61.0 | 80.9 | Demoted: was 3rd for SST |
| 9 | 2003 | 70.0 | 50.0 | 60.0 | 73.2 | Demoted: atmospheric heatwave but moderate BGC |
| 10 | 2015 | 35.8 | 76.9 | 56.3 | 42.0 | Promoted: significant nutritive stress |
What the 2-factor vs 3-factor comparison reveals
Adding the nutritive component does not overturn the ranking — 2006 remains first, 1999 second — but it reshuffles several mid-ranking years with interesting consequences:
- 2011 is the most relevant discovery. In the old index it was mid-table (55.8, around 11th place); in the new index it rises to 4th place (69.7) because the nutritive component is extraordinarily high (92.3 out of 100). This means that in that year the Mediterranean biogeochemical model recorded a particularly imbalanced N:P ratio and one of the highest summer NPP values. It is worth checking, if one has contacts with local operators of the Calabrian Tyrrhenian coast, whether they recall anomalous mucilage phenomena in that year.
- 2005 and 2015 are two other years 'promoted' by the new index. They had modest SST but high nutritive stress. The old index underestimated them.
- 2007 and 2003 are 'demoted'. They were top for SST alone (2003 was the year of the European heatwave, 2007 a warm year), but the BGC shows that in both cases the nutritive picture was moderate. The meteo-marine conditions were there, but the phytoplankton was less stressed than expected.
- The recent years (2024, 2023, 2022) remain steadily above average. They are not in the top 3, but they are consistently around 6th-8th place — the warming has progressed and with it the precursor preconditions.
Operational implication: the alert system proposed in Ch. 10 can be more complete if it also includes a seasonal check of the BGC model (near-real-time satellite chlorophyll is freely available; it replaces NPP as a proxy). It is not strictly necessary for most years — SST + wind are enough — but it can prevent the underestimation of years 'of the 2011 type' where the nutritive component deviates from the average.
6.6 Recent annual cycles vs the climatology
Figure 6.2 visually compares the daily course of the SST over the last 5 years (coloured lines) with the mean course of the 30-year period 1991-2020 (thick black line) and with its typical variability band (grey zone, ±1 standard deviation). The horizontal dashed lines indicate the operational thresholds of interest: 22 °C (the onset of thermal stratification) and 24 °C (the start of the window potentially favourable to mucilage).
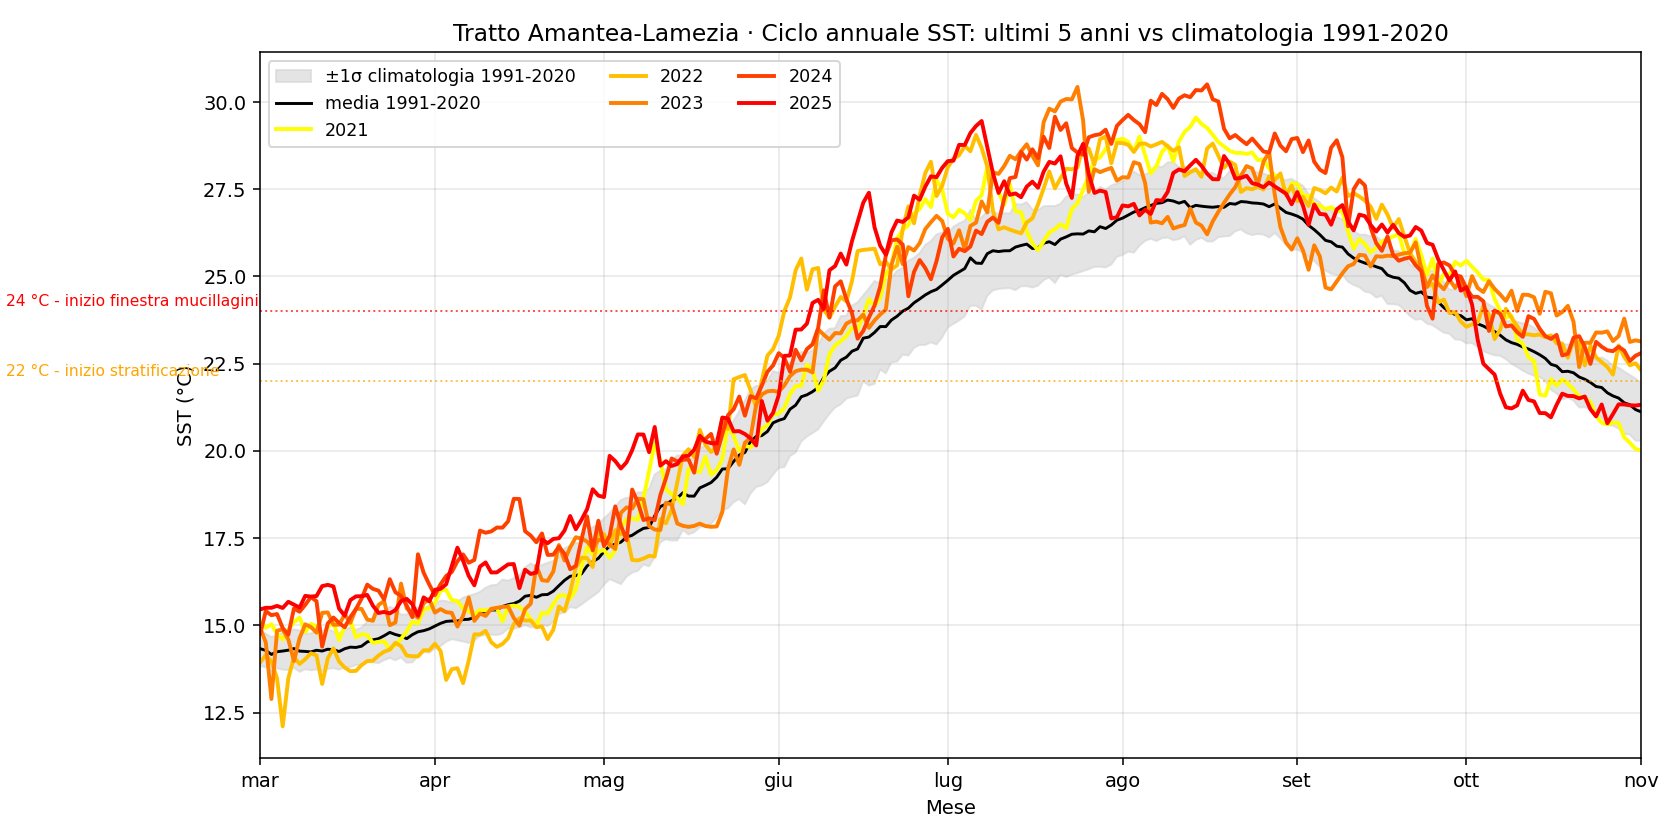
Figure 6.2 — Daily course of the SST on the Amantea-Lamezia stretch. Black line: the 1991-2020 mean. Grey band: ±1 standard deviation relative to that mean. Coloured lines: each of the last 5 years (2021-2025). The two dotted horizontal lines mark the thresholds of 22 °C (the onset of stratification) and 24 °C (the start of the window of favourable conditions).
How to read the chart
The curves of the last 5 years sit systematically above the entire historical variability band from June to September. This means that these are not summers 'above average' in the ordinary sense of the term — they are summers off the scale relative to what was recorded in the three preceding decades. Three concrete operational observations:
- May: the 2025 SST fluctuates around 20 °C, when the historical mean was 18 °C. By June the water is therefore already ready to stratify.
- July: all the last 5 years exceed 27 °C at the peak. The climatology was at 25.5 °C.
- October: the sea no longer cools down. The stratification dissolves later, the windows of favourable conditions extend until mid-October, when in the past they closed at the end of September.
6.7 Operational implications for the tourism sector
On the basis of the historical data and the computed indicators, it is possible to outline an indicative calendar of exposure to conditions favourable to mucilage for the operators of the Amantea-Lamezia stretch:
| Period | Operational guidance |
|---|---|
| May | SST monitoring: if the mean exceeds 19 °C, the summer starts stratified (a condition verified in 4 of the last 5 years) |
| First half of June | If the SST exceeds 22 °C by 5 June, the extended thermal window is practically certain |
| July-August | The peak of exposure. A critical period for the visual appearance of the coast; daily visual surveillance is recommended |
| September | Historically a period of decreasing exposure, but in the last 5 years the sea stays above 24 °C until the end of the month — prolonged exposure |
| October | Exposure increasing relative to the past; it is worth considering this month too in the assessments |
Concrete actions recommended for beach clubs, hotels, coastal restaurants, charters:
- Preventive communication. Prepare, already at the start of the season, informational content (a web page, social-media posts) that explains to the public what mucilage is, that it is not pollution (a common misperception), and that it is not toxic on contact. Anticipating the correct narrative reduces the reputational impact of any viral photos.
- Early monitoring. Subscribe to the weekly ARPA Calabria bulletin for Ostreopsis and bathing-water quality. For more structured operators: daily photographic documentation of the shoreline (drone or webcam) as evidence of the 'reference state'.
- Active cleaning. Decaying mucilage deposited on the shoreline should be removed within 24-48 hours: as it decays it emits foul-smelling sulphur compounds and rapidly worsens the bathing experience.
- Diversification of activities. When there are peaks of mucilage on the shoreline, alternative activities (mountain excursions, inland parks, local food and wine) can preserve revenue while waiting for bathing conditions to return.
- Territorial coordination. For associated operators (tourism consortia, Chambers of Commerce), a joint observatory of sea quality allows a unified response instead of scattered individual initiatives.
7. The microbiological quality of the bathing waters: 35 years of history
Up to this chapter we have dealt with the physical conditions of the sea — temperature, wind, bathymetry — and their environmental effects (mucilage, ecological stress). This Part III moves to a complementary but distinct dimension: the microbiological quality of the waters where people bathe. It is the dimension that directly concerns the health safety of the tourist, and it is regulated by a specific European directive (BWD - Bathing Water Directive 2006/7/EC, transposed in Italy by Legislative Decree 116/2008) that imposes mandatory monitoring and transparent annual classifications for every single beach.
7.1 What is (and what is NOT) a bathing water
Italian legislation is clear: each Region identifies every year the areas where bathing is expected (typically the beaches frequented by bathers) and entrusts the local health authorities with monitoring them through periodic sampling. Each area has precise geographical boundaries and a name (for example 'BAR VITTORIA' at Falerna, or 'LIDO COMUNALE' at Reggio Calabria), corresponds to a sampling point, and has its own documented history.
By law the following are excluded a priori from the definition of bathing water:
- The mouths of rivers and streams (uncontrolled freshwater inflow, often polluted by upstream discharges).
- Harbour areas and the stretches of sea used for vessel manoeuvring (risk of accidents, oils, technical discharges).
- Military and national-security areas.
- Discharge areas (treatment plants, submarine outfalls).
This clarification is important in order to read the data without misunderstandings: the 'critical' points we will see are never a river mouth or a harbour as such, because these are simply never classified. The problems that emerge from the data concern bathing areas ADJACENT to contamination sources (a beach club near a river mouth, an urban beach crossed by a discharge into the sea). This is a crucial point for correctly interpreting the results for Reggio Calabria, presented in Chapter 8.
7.2 The two sources used
The analysis draws on two complementary sources, both public. The Bathing Waters Portal of the Italian Ministry of Health makes the data of the last two bathing seasons (current + previous) available for consultation. For each area one can see the individual samples collected by the local health authorities with the date, the measured values of E. coli and intestinal enterococci, and whether they exceeded the regulatory limits. The European Environment Agency (EEA) Bathing Water Directive dataset, on the other hand, provides for each European area the final annual classification (Excellent / Good / Sufficient / Poor) from 1990 to 2024 — 35 years of harmonised history. The first dataset gives granularity but little historical depth; the second gives historical depth but only a summary annual classification.
The two sources complement each other and were both loaded into the SQLite database acque_calabria.db. The technical details of the two datasets, including the reverse engineering of the Italian portal's API, are described in Part I Chapter 1.
7.3 The Calabria picture
Over the 35 years of EEA history, there are 652 Calabrian bathing areas that have at least one documented classification (some have been decommissioned or reclassified over the years, and so are no longer active today). Among those currently active on the Ministry portal there are 519 out of 552 total. The historical distribution of the annual classifications is as follows:
| Class | Area-years (total 21,564) | % of the total |
|---|---|---|
| 1 - Excellent | 18,817 | 87.3% |
| 2 - Good | 520 | 2.4% |
| 3 - Sufficient (incl. 'Good or Sufficient') | 894 | 4.1% |
| 4 - Poor | 641 | 3.0% |
| 0 - Not classified | 692 | 3.2% |
Overall the picture is positive: 87% of area-years are classified Excellent. The Calabrian waters are therefore on average good, and from this point of view the region holds its own in comparison with the rest of Italy and Europe. But the 3% of area-years in the 'Poor' class (641 cases) is not uniformly distributed: it is concentrated on a few specific areas, some of which have long-standing chronic problems. The next chapter will identify who and where.
The official ARPACAL report "Quality of the bathing waters of the Calabria Region — Year 2025" (Managerial Decree No. 5457 of 11/04/2025, authors E. Barillari et al.) reports data that match ours to within ±0.5%. Out of 649 Calabrian bathing waters monitored in 2024 with 3,811 samples and 7,622 analyses in the ARPACAL accredited laboratories:
| Province | Total waters | % Excellent | % Poor |
|---|---|---|---|
| Cosenza (northern Tyrrhenian coast) | 237 | 95.36% | 0.84% |
| Catanzaro (southern Tyrrhenian + Ionian) | 102 | 97.06% | 0.00% |
| Crotone (north-eastern Ionian) | 85 | 90.59% | 0.00% |
| Reggio Calabria (Far South) | 161 | 80.12% | 8.07% |
| Vibo Valentia (central Tyrrhenian) | 64 | 90.62% | 1.56% |
| TOTAL CALABRIA | 649 | 90.91% | 2.47% |
Three observations concordant with our analysis: (1) the regional figure of 90.91% Excellent confirms our 87.3% historical EEA and the 93% recent; (2) Reggio Calabria with 8.07% Poor is confirmed as the only structural problem area (it matches our 7.87% historical and the 8.45% of recent exceedances); (3) the 2024→2025 dynamics documented by the report reveal 12 areas promoted Good→Excellent (11 in the province of Cosenza alone, on the Tyrrhenian) and 4 demoted Good→Sufficient in Reggio Calabria alone (Melito Porto Salvo and Lido Comunale Villa Zerbi). The pattern of improvement of the Tyrrhenian and of degradation of the Far South is confirmed by ARPACAL in the most recent movements.
7.4 Historical trend by coastal zone
Taking up the same division into four zones used in Part II (Tyrrhenian, Far South, South Ionian, North Ionian), one can see how the percentage of areas in the 'Poor' class has evolved over 35 years for each zone. The result tells a story in three phases.
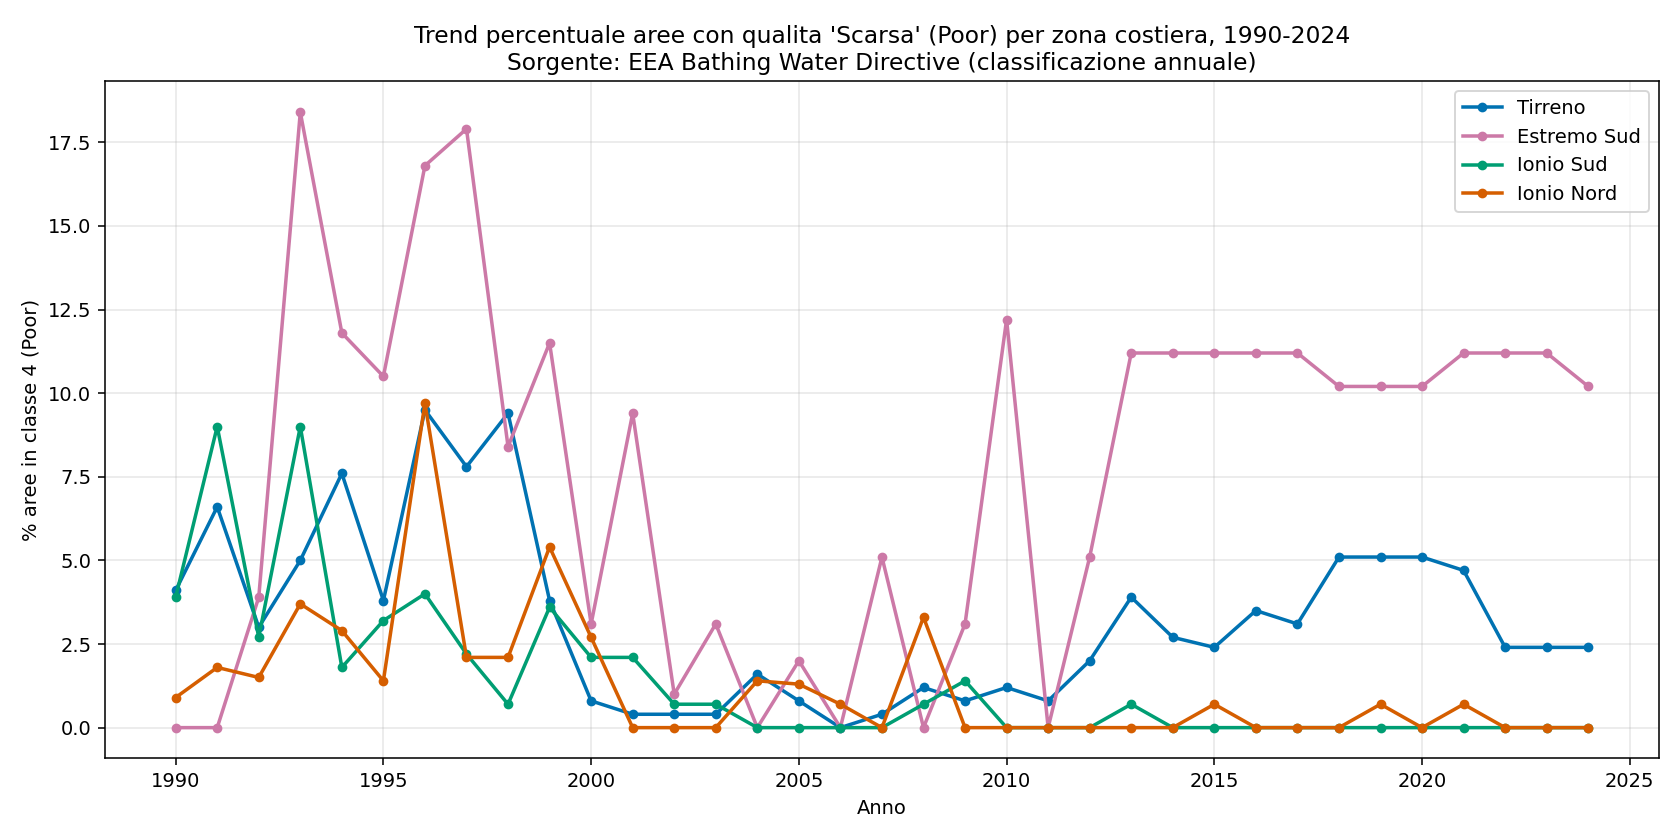
Figure 7.1 — Percentage of bathing areas classified 'Poor' each year, from 1990 to 2024, separately for the four coastal zones.
- The 1990s (1990-2000): all coasts show significant percentages of Poor areas (5-12%), with the Far South reaching striking peaks of up to 17%. This reflects the state of wastewater treatment in the Italian coastal municipalities in those years: many treatment plants were undersized or absent, and domestic discharges ended up in the sea practically untreated.
- The 2000s (2001-2010): an improving trend on all coasts, in particular the Tyrrhenian and the Ionian. It coincides with the major European investments in treatment works (POR programmes, Water Protection Plans, EU infringement procedures that pushed Italy to invest).
- The years 2010-2024: the situation stabilises. The South and North Ionian are almost always at zero. The Tyrrhenian fluctuates around 3-5%. The Far South remains STRUCTURALLY around 10-12%, with no significant improvement in the last decade.
The 'stability' of the Far South over the last 15 seasons is the most worrying figure: it indicates that the problems are not episodic (a particularly rainy year, a one-off failure) but structural (an infrastructure problem that the improvement of the last 30 years has not solved). The next chapter is devoted exclusively to the analysis of this anomaly.
The silent success of the Calabrian Tyrrhenian coast (1990-2024)
Among the three phases described above, there is a story that deserves to be told more explicitly because it often goes unnoticed: the clear and progressive improvement of the Calabrian Tyrrhenian coast. In the 1990s this coast had over 10% of bathing areas classified 'Poor' every year — with peaks of 12% in the first years of the series. Today that percentage is steadily around 3%, with years in which it drops even below this value. It is a reduction of 70-75% in 35 years, statistically robust and maintained over time.
This improvement did not come on its own: it is the concrete and documentable result of the major European and national investments in treatment works that affected the Calabrian Tyrrhenian coastal municipalities in the 2000s and 2010s — the treatment plants of Belvedere Marittimo, Cetraro, Paola, Amantea, Falerna, Lamezia, Pizzo, and Vibo Marina, in addition to the connected sewer infrastructure. It is rare to see so clearly, in environmental data, the effect of a public investment policy: the Calabrian Tyrrhenian coast is one of those cases.
The datum is even more significant if one considers that the Tyrrhenian is the Calabrian coast with the largest absolute number of bathing areas (221 active today, against 145 of the North Ionian, 100 of the South Ionian, 74 of the Far South) and therefore also with the largest potential concentrated human load. Reducing the exceedance rate on such an extended and populated coast is a non-trivial result. The confirmation — as we will see in Chapter 8 — comes from the most recent data, where the Tyrrhenian shows the best microbiological performance in Calabria relative to the volume of monitoring carried out.
7.5 Heatmap by coastal zone
For each coastal zone a 'heatmap' is provided: a matrix in which each row is a bathing area and each column a year (from 1990 to 2024). The colour of each cell indicates the classification of that area in that year: green = Excellent, blue = Good, orange = Sufficient, red = Poor, grey = not classified. The areas are ordered from the worst (at the top) to the best (at the bottom). At a glance one can see the 'red stripes' that identify the historically most problematic areas.
Tyrrhenian
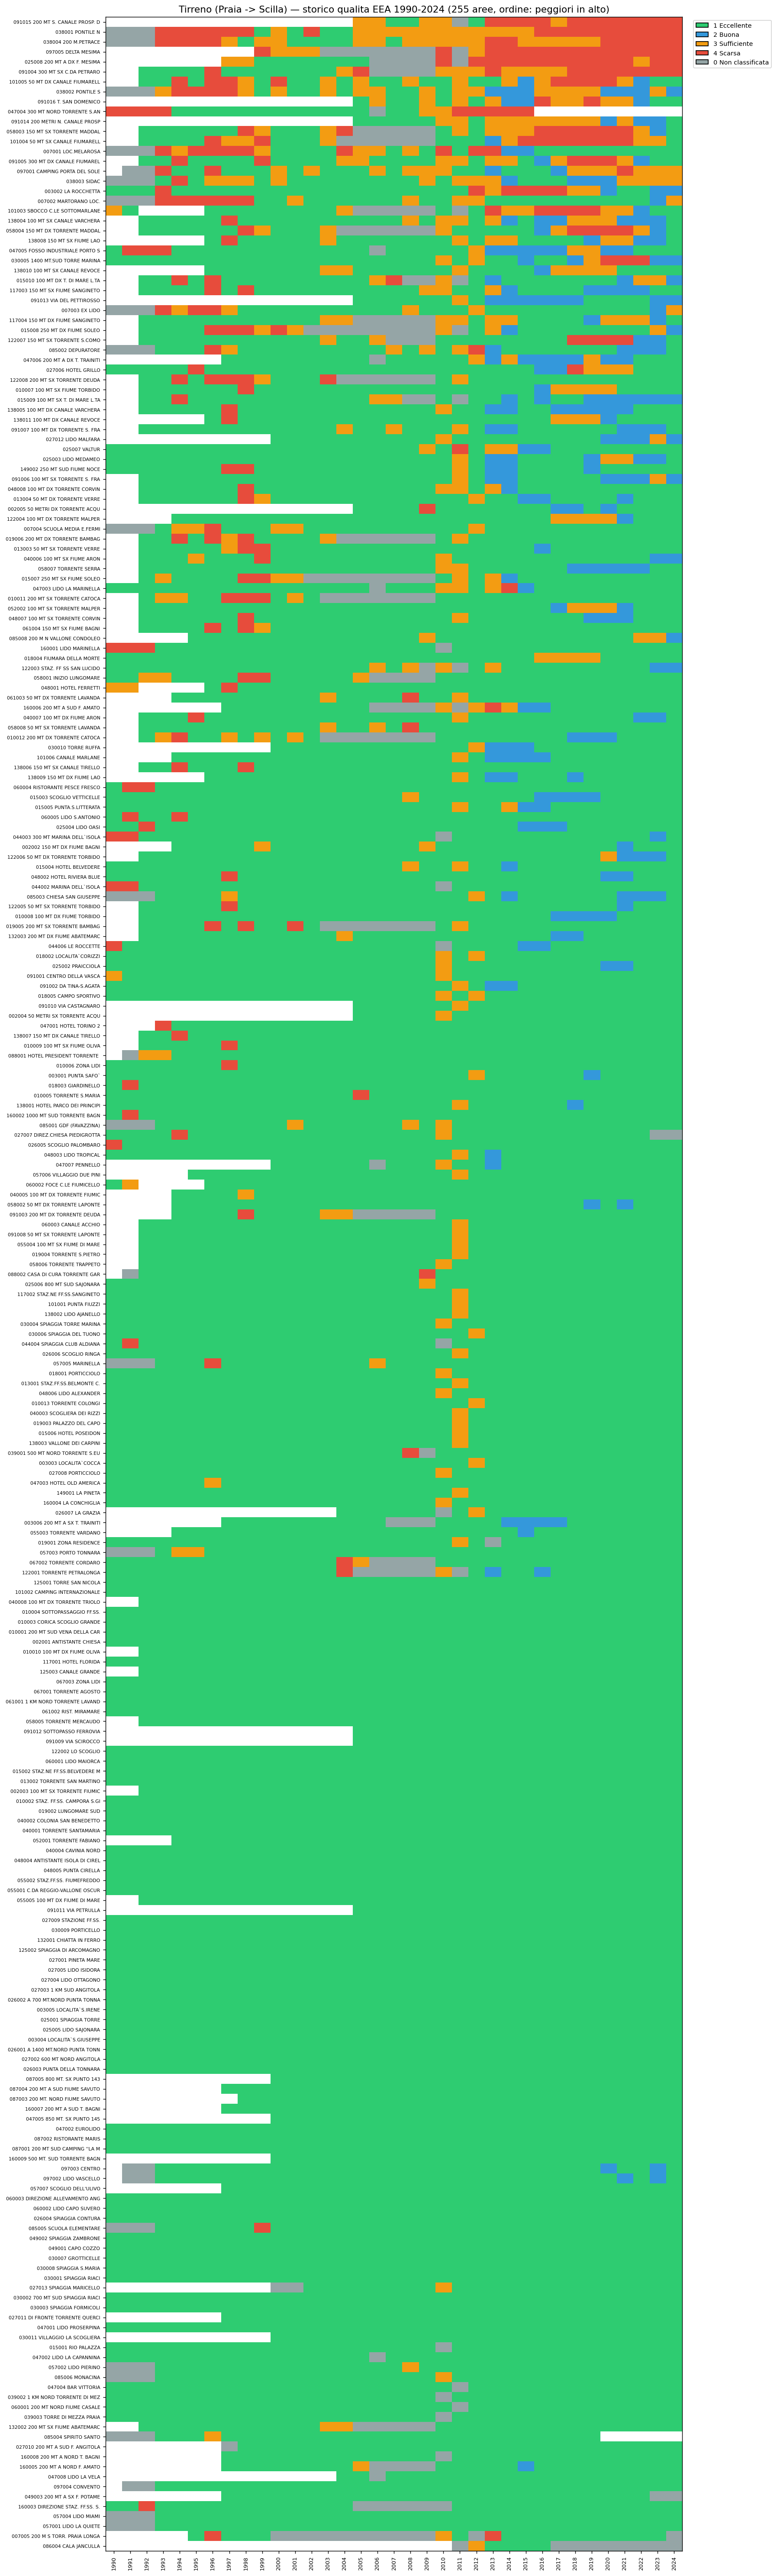
Figure 7.2 — Calabrian Tyrrhenian coast: historical quality heatmap 1990-2024 for the 255 bathing areas of the zone.
On the Tyrrhenian coast most areas are predominantly green (Excellent). However, a red band is visible in the upper part of the heatmap: about ten areas with recurring problems, concentrated mainly around the mouth of the Mesima (Rosarno-Gioia Tauro) and in a few municipalities of the Cosenza area. These areas often show a clear improvement after 2010, but then worsen again in some years.
Far South (the metropolitan area of Reggio Calabria)
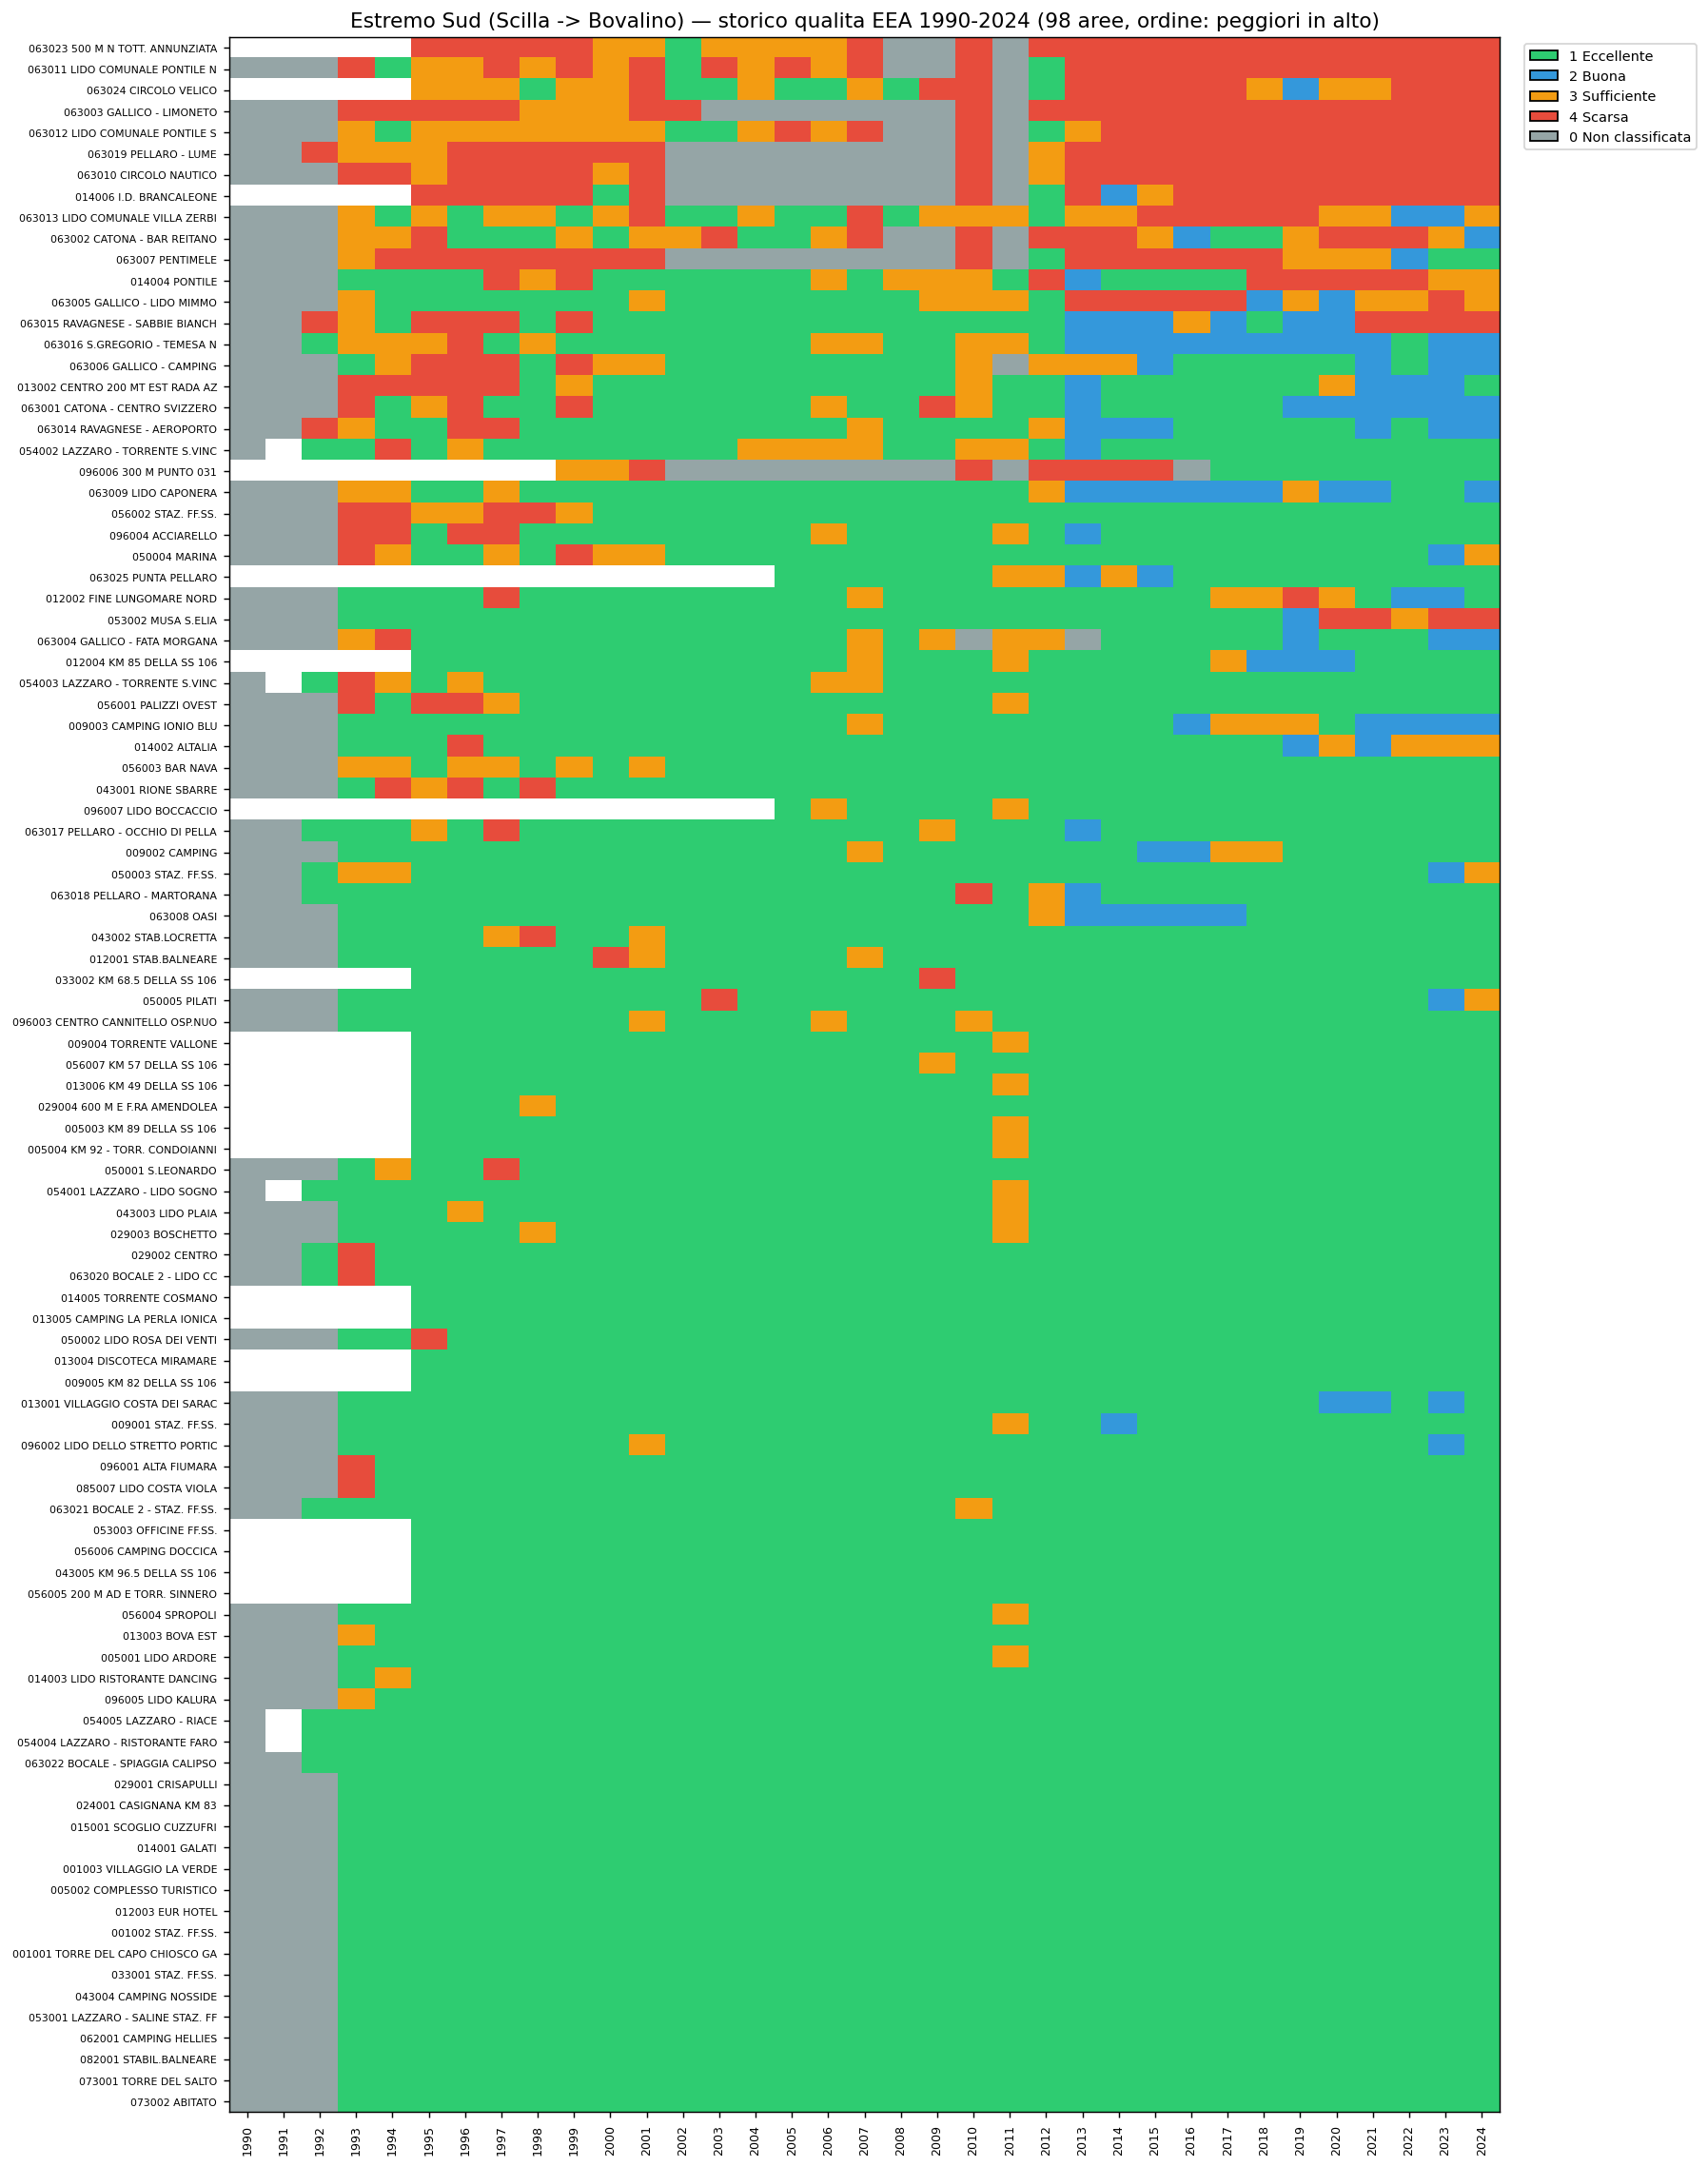
Figure 7.3 — Far South: historical quality heatmap for the 98 bathing areas of the zone, mainly in the municipality of Reggio Calabria.
The picture here is far more critical. A wide red band is visible that persists for more than twenty years — these are the bathing areas of the Strait, within the urban area of Reggio Calabria. No substantial improvement over time can be seen. Chapter 8 is devoted exclusively to the analysis of this zone.
South Ionian
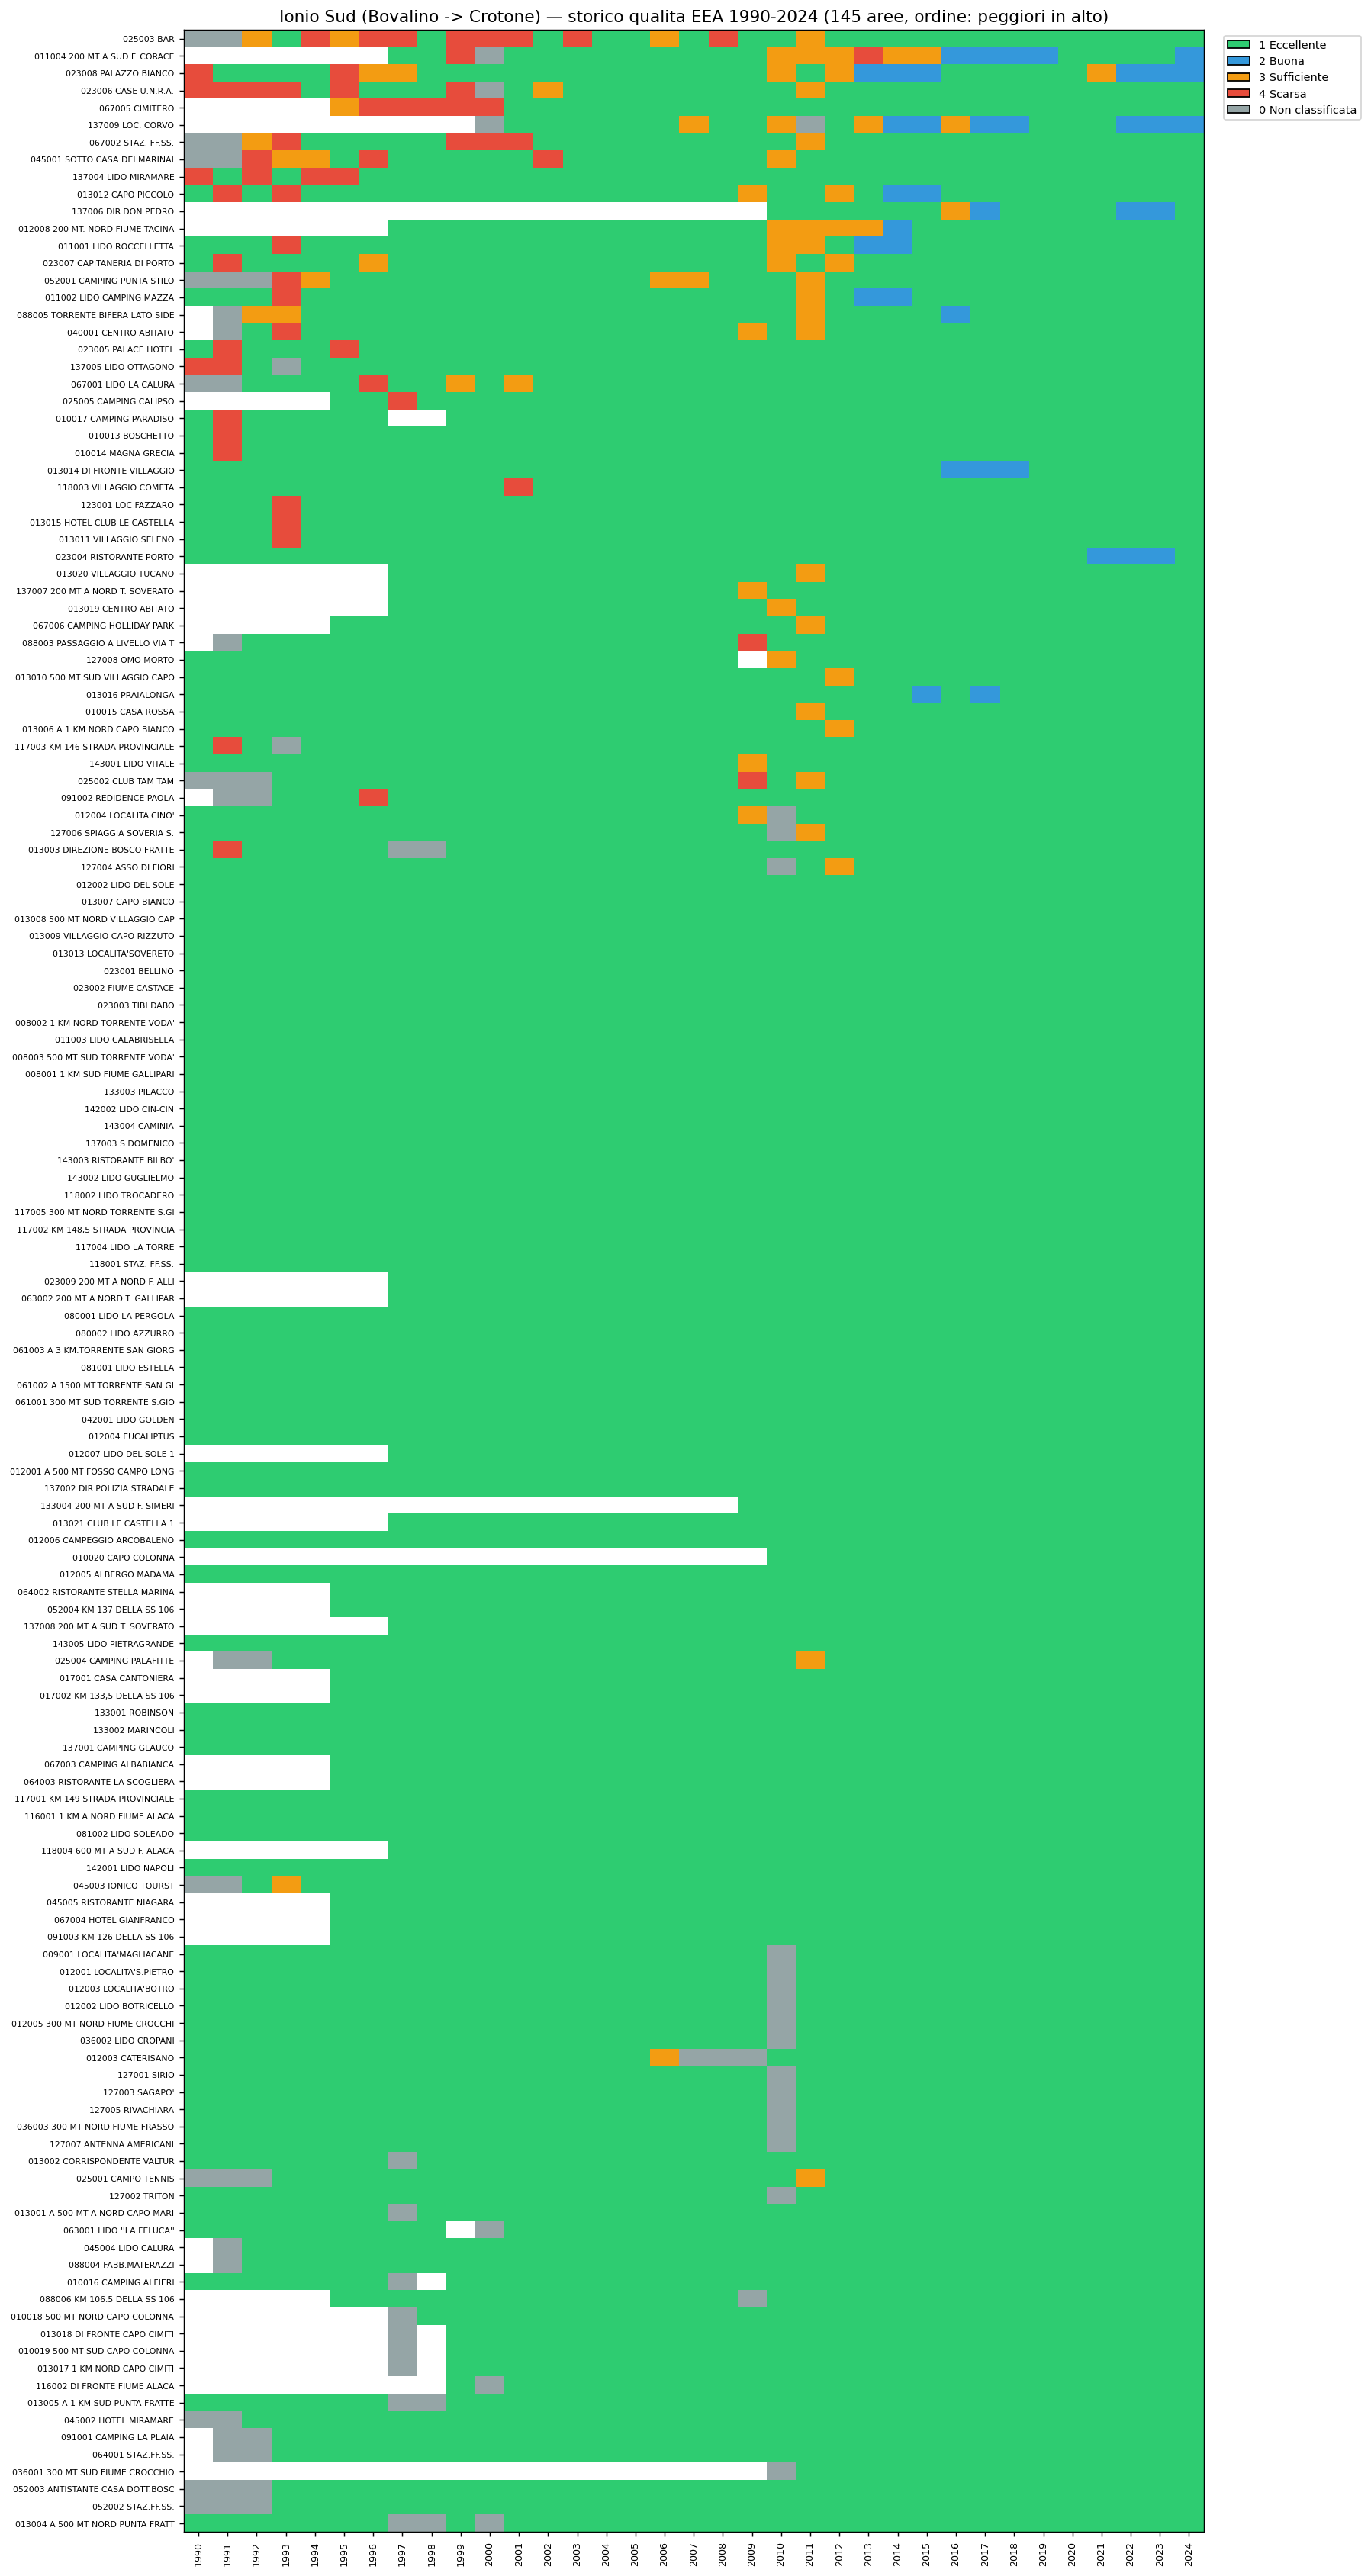
Figure 7.4 — South Ionian (Bovalino-Crotone): quality heatmap for the 145 bathing areas.
The South Ionian is the 'cleanest' zone of Calabria: the heatmap is almost entirely green. Very few rows show red periods, and these are typically single isolated years, not persistent patterns. This confirms the primacy of this coast from the microbiological point of view too.
North Ionian
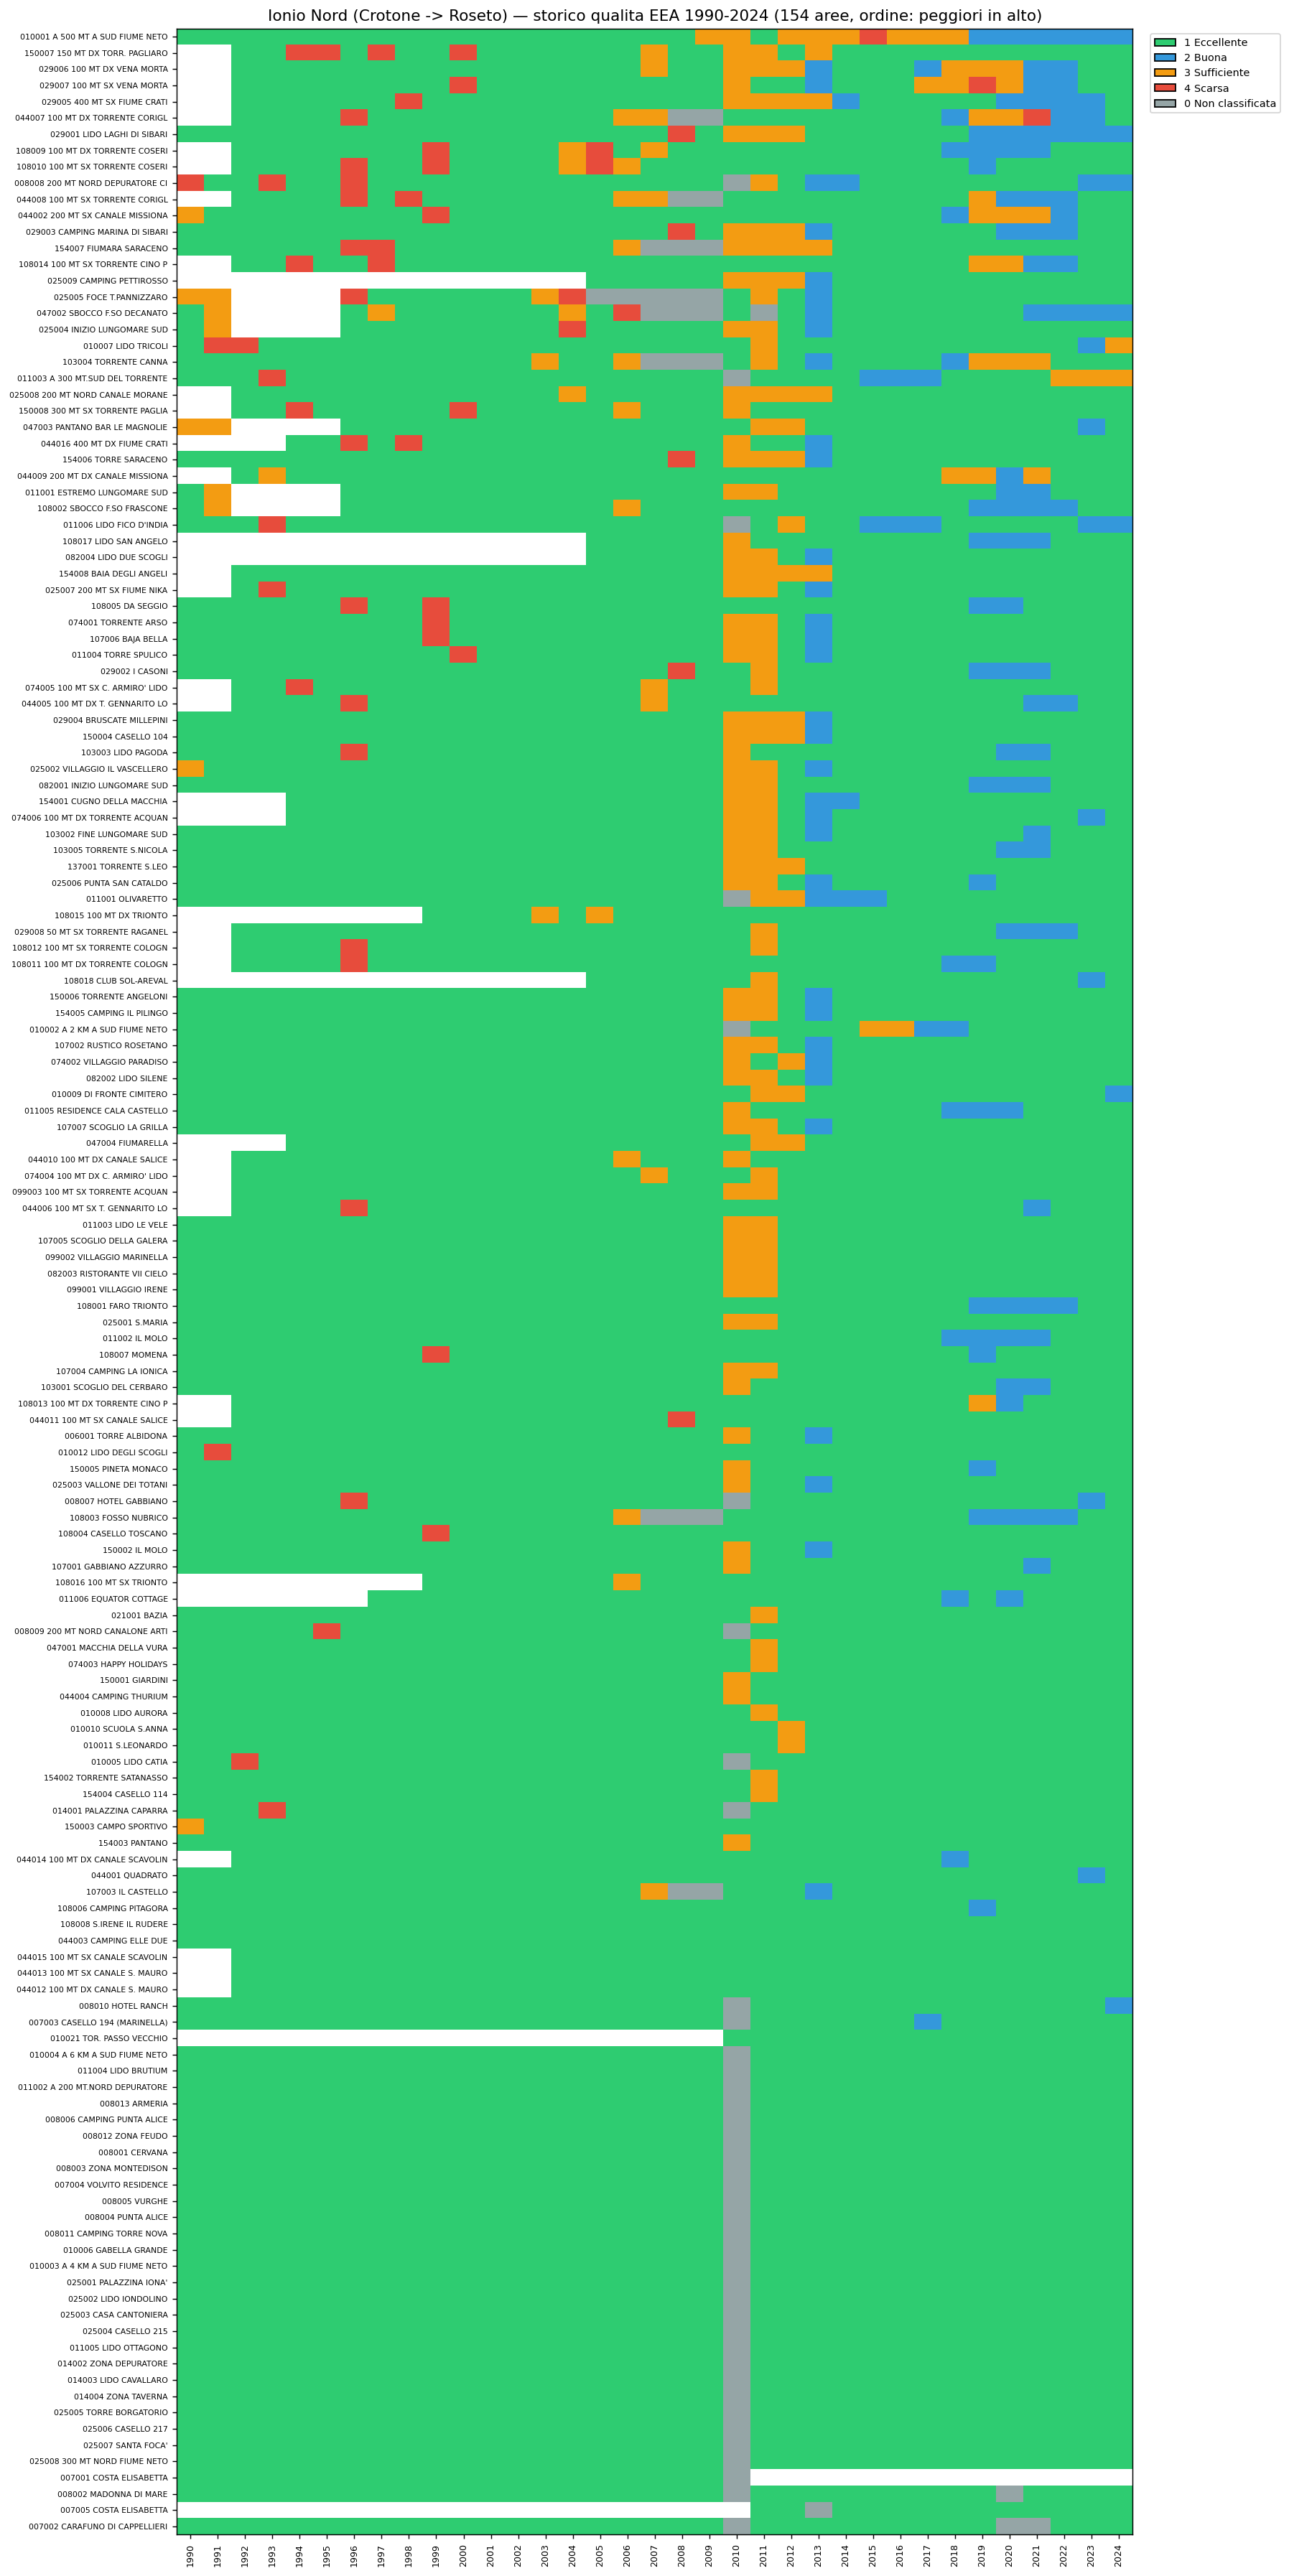
Figure 7.5 — North Ionian (Crotone-Roseto): quality heatmap for the 154 bathing areas.
The North Ionian too is predominantly green, with a few red stripes around the mouth of the Crati (Sibari) and in some municipalities of the eastern Cosenza area. Better conditions than the Tyrrhenian, slightly less excellent than the South Ionian.
7.6 The 'Hall of Shame': the historically most problematic areas
Over the 35 years of history, there are 203 Calabrian bathing areas that have had at least one year with a Poor classification. The table lists the first 10 by cumulative years in Poor.
| Area name | Zone | Poor years / total | % Poor | First Poor year | Last Poor year |
|---|---|---|---|---|---|
| GALLICO - LIMONETO | Far South | 21/35 | 60.0% | 1993 | 2024 |
| PELLARO - LUME | Far South | 20/35 | 57.1% | 1992 | 2024 |
| CIRCOLO NAUTICO | Far South | 20/35 | 57.1% | 1993 | 2024 |
| LIDO COMUNALE PONTILE N | Far South | 20/35 | 57.1% | 1993 | 2024 |
| 500 M N TOTT. ANNUNZIATA | Far South | 20/30 | 66.7% | 1995 | 2024 |
| I.D. BRANCALEONE | Far South | 17/30 | 56.7% | 1995 | 2024 |
| PONTILE N | Tyrrhenian | 16/35 | 45.7% | 1993 | 2024 |
| PENTIMELE | Far South | 15/35 | 42.9% | 1994 | 2018 |
| LIDO COMUNALE PONTILE S | Far South | 14/35 | 40.0% | 2005 | 2024 |
| DELTA MESIMA | Tyrrhenian | 14/26 | 53.8% | 1999 | 2024 |
The figure is striking: 9 of the 10 most critical areas are in the same municipality (Reggio Calabria, ISTAT code 080063). The only external one is 'Delta Mesima' on the Tyrrhenian coast, the mouth of the Mesima river in the Rosarno-Gioia Tauro area (14 Poor years out of 26 recorded). The pattern of concentration in the Reggio Calabria area deserves a dedicated analysis.
7.7 The 'redeemed' areas: real improvements
Not everything is unchangeable: 172 Calabrian areas that have had at least one year with a Poor classification are today in the Excellent or Good class. These are improvement stories, typically linked to infrastructure works (new treatment plants, completion of sewer networks). The table shows examples of areas that had their last 'Poor' year many years ago and are clean today:
| Area | Zone | Total Poor years | Last Poor year | Last classified year | Years since 'redemption' |
|---|---|---|---|---|---|
| SCOGLIO PALOMBARO | Tyrrhenian | 1 | 1990 | 2024 | 34 |
| LE ROCCETTE | Tyrrhenian | 1 | 1990 | 2024 | 34 |
| MAGNA GRECIA | South Ionian | 1 | 1991 | 2024 | 33 |
| SPIAGGIA CLUB ALDIANA | Tyrrhenian | 1 | 1991 | 2024 | 33 |
| KM 146 STRADA PROVINCIALE | South Ionian | 1 | 1991 | 2024 | 33 |
| CAPITANERIA DI PORTO | South Ionian | 1 | 1991 | 2024 | 33 |
| GIARDINELLO | Tyrrhenian | 1 | 1991 | 2024 | 33 |
| BOSCHETTO | South Ionian | 1 | 1991 | 2024 | 33 |
| 1000 MT SUD TORRENTE BAGNI | Tyrrhenian | 1 | 1991 | 2024 | 33 |
| LIDO OTTAGONO | South Ionian | 2 | 1991 | 2024 | 33 |
These are positive examples: they show that water quality can be recovered when the causes (untreated discharges, undersized infrastructure) are addressed.
8. Tyrrhenian vs Ionian comparison and the anomalous case of Reggio Calabria
This chapter answers two connected questions. The first: is the Calabrian Ionian coast — which for SST and marine dynamics is similar to or even worse than the Tyrrhenian (see Part II) — better, similar or worse from the microbiological point of view? The second: why does the metropolitan area of Reggio Calabria have such anomalous characteristics relative to the rest of the region, and what hypotheses can we make about the causes?
8.1 Summary table of the four zones
| Zone | Active areas | % Excellent (1990-2024) | % Poor (1990-2024) | Exceedances 25-26 | % exceedances 25-26 |
|---|---|---|---|---|---|
| Far South (Scilla -> Bovalino) | 74 | 74.4% | 7.87% | 50 | 8.45% |
| North Ionian (Crotone -> Roseto) | 145 | 90.2% | 1.18% | 20 | 1.75% |
| South Ionian (Bovalino -> Crotone) | 100 | 94.9% | 1.23% | 5 | 0.59% |
| Tyrrhenian (Praia -> Scilla) | 221 | 86.2% | 3.14% | 11 | 0.62% |
The answer is clear-cut: the South Ionian is by far the cleanest zone microbiologically, with 94.9% of area-years classified Excellent over 35 years of history and only 0.59% of exceedances in the last two seasons. The North Ionian follows (90.2% Excellent). The Tyrrhenian is around the regional average (86.2% Excellent). The Far South is the negative outlier: only 74.4% of area-years in Excellent, and 7.87% of area-years in Poor — six to seven times the regional average.
There is, however, a second level of reading of the table that the historical EEA data alone does not reveal and that deserves a dedicated analysis: the efficiency of the recent monitoring, that is the ratio between the volume of analyses carried out and the rate of exceedances detected. Under this lens — closer to the current operational reality — the Tyrrhenian emerges in a very positive light and deserves a dedicated section.
8.2 The Calabrian Tyrrhenian coast: the coast with the most solid figures (2025-2026)
Looking at the most recent seasons — the only ones for which we have the individual samples from the Ministry of Health portal — a datum emerges that was not visible from the historical EEA data alone and that significantly changes the reading of the Calabrian picture. The Tyrrhenian is the coast with:
- The LARGEST absolute volume of microbiological analyses: 1,760 samples between 2025 and the first months of 2026, equal to 47% of the total of all the analyses of Calabria. Practically half of the regional monitoring is carried out on the Tyrrhenian.
- The SMALLEST absolute number of exceedances among the coasts with significant volumes: only 11 'over-limit' results out of 1,760 analyses. The South Ionian has 5 but over a volume of 842 analyses (less than half); the Far South has 50 over 592 analyses.
- An exceedance rate of 0.62%, practically identical to the 0.59% of the South Ionian — the difference is just three hundredths of a percentage point, statistically irrelevant — but reached over a volume of analyses more than double. This makes the Tyrrhenian figure statistically more robust: a rate close to zero measured over almost 2,000 samples is much stronger evidence than the same rate measured over 800.
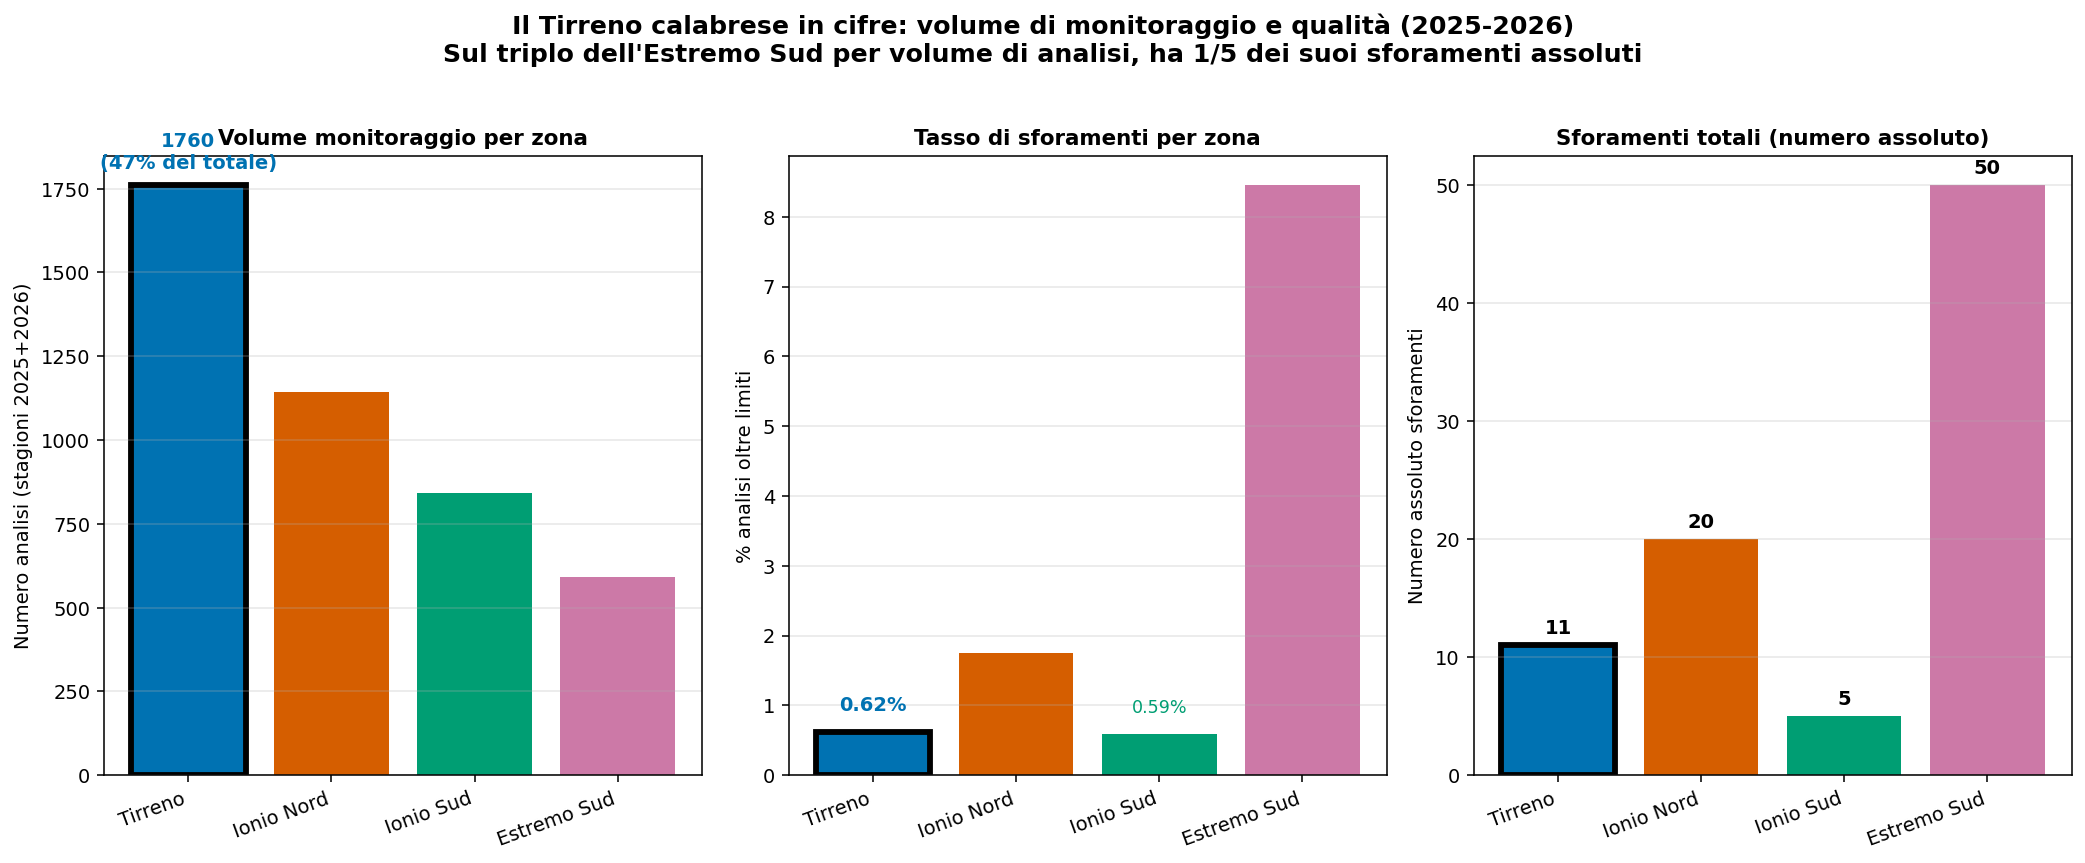
Figure 8.2 — The Calabrian Tyrrhenian coast in figures in the 2025-2026 seasons, over three panels. Left: monitoring volume (1,760 analyses, 47% of the Calabrian total). Centre: exceedance rate (0.62%, practically identical to the South Ionian). Right: absolute number of exceedances (11, against the 50 of the Far South). The Tyrrhenian is highlighted with a black border.
The efficiency of the monitoring: at a glance
To visualise more intuitively the positioning of the four zones relative to the two dimensions 'monitoring volume' and 'criticality rate', the scatterplot of Figure 8.3 is useful. On the horizontal axis is the volume of analyses carried out, on the vertical axis the exceedance rate. The bottom-right corner is the 'virtuous zone': where any stretch of bathing coast would want to be (high monitoring, low exceedances).
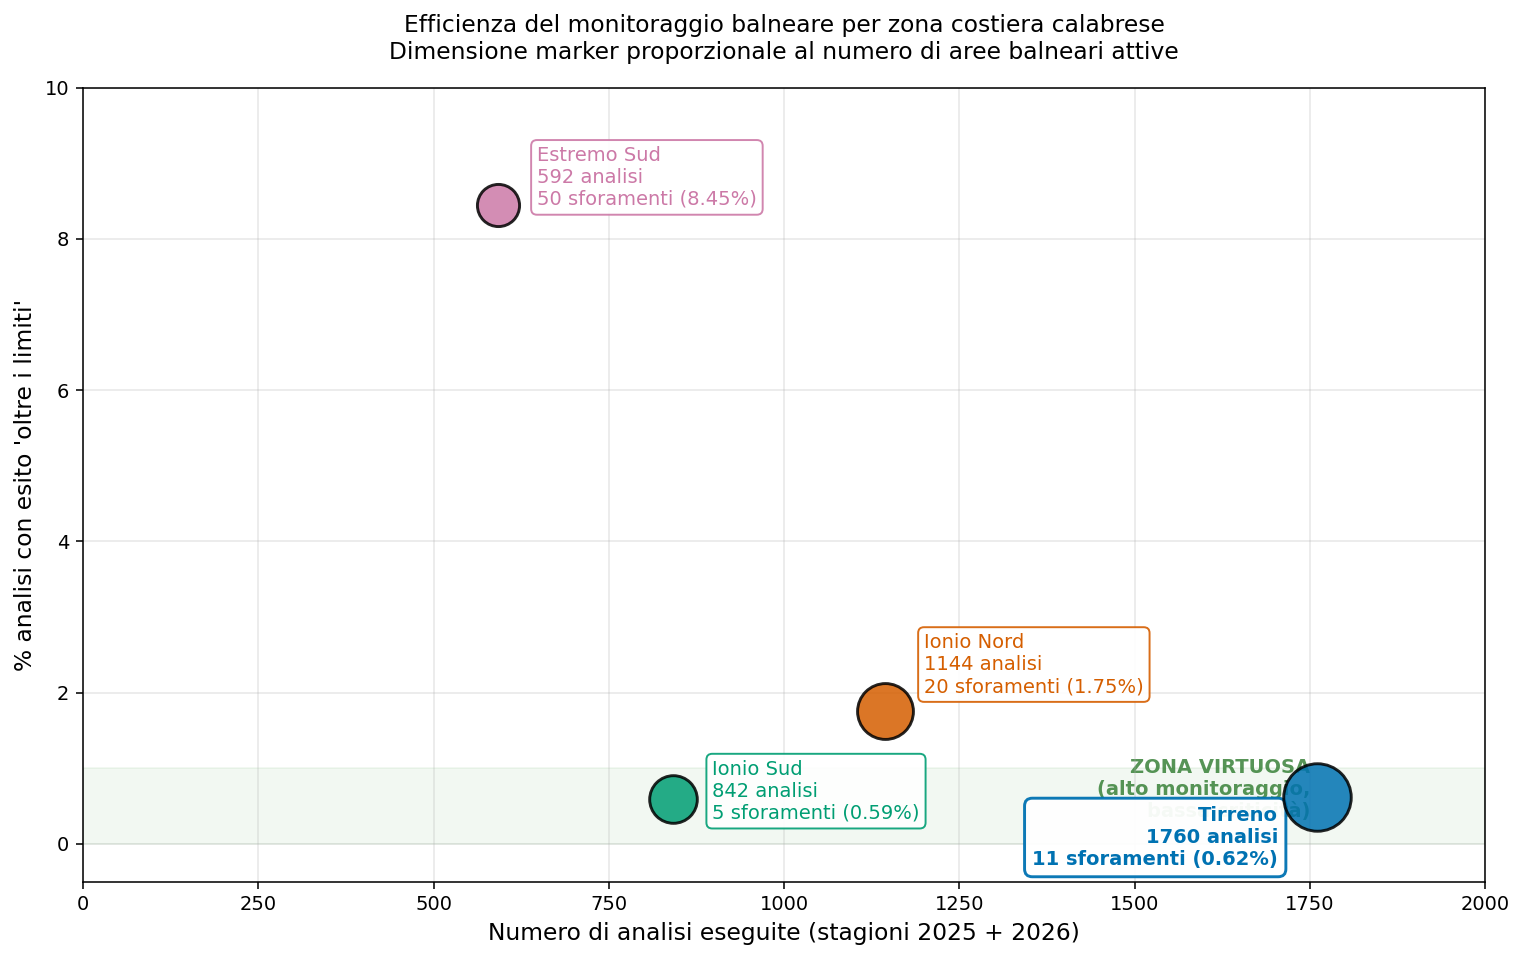
Figure 8.3 — Monitoring efficiency by Calabrian coastal zone, 2025-2026 seasons. The size of each marker is proportional to the number of active bathing areas in the zone. The light-green band identifies the 'virtuous zone' (exceedances < 1%). The Tyrrhenian and the South Ionian are both in the virtuous zone, but the Tyrrhenian with more than double the volume of analyses.
Three observations emerge from the chart:
- The Tyrrhenian (blue marker) and the South Ionian (green marker) are both in the virtuous zone (below the 1% exceedance band), but in two very different positions: the Tyrrhenian is at the far right (high volume of analyses), the South Ionian is in the centre (intermediate volume).
- The North Ionian (orange marker) is intermediate: a significant volume (1,144 analyses) but a higher exceedance rate (1.75%) — not bad at all, but outside the narrow virtuous zone.
- The Far South (pink-magenta marker) is completely isolated in the top left: few samples (592, the lowest volume) and a high percentage of exceedances (8.45%). It is the worst quadrant of the chart.
The message for the Tyrrhenian is clear and deserves to be repeated: a coast that analyses 1,760 samples and finds 11 of them out of norm is a coast that works from the point of view of microbiological bathing-water quality. It is not a datum that one often sees communicated. The Calabrian Tyrrhenian coast, after decades of investment in treatment infrastructure (see Ch. 7.4), today reaps the rewards.
Monthly trend of the recent seasons
Figure 8.4 shows the month-by-month trend of the two seasons (2025 complete season, 2026 ongoing season), separating the volume of analyses and the percentage of exceedances. The regularity of the monitoring on the Tyrrhenian (the blue line practically constant around 220 samples per month) relative to the other coasts is clearly visible, where the volume is smaller and more variable.
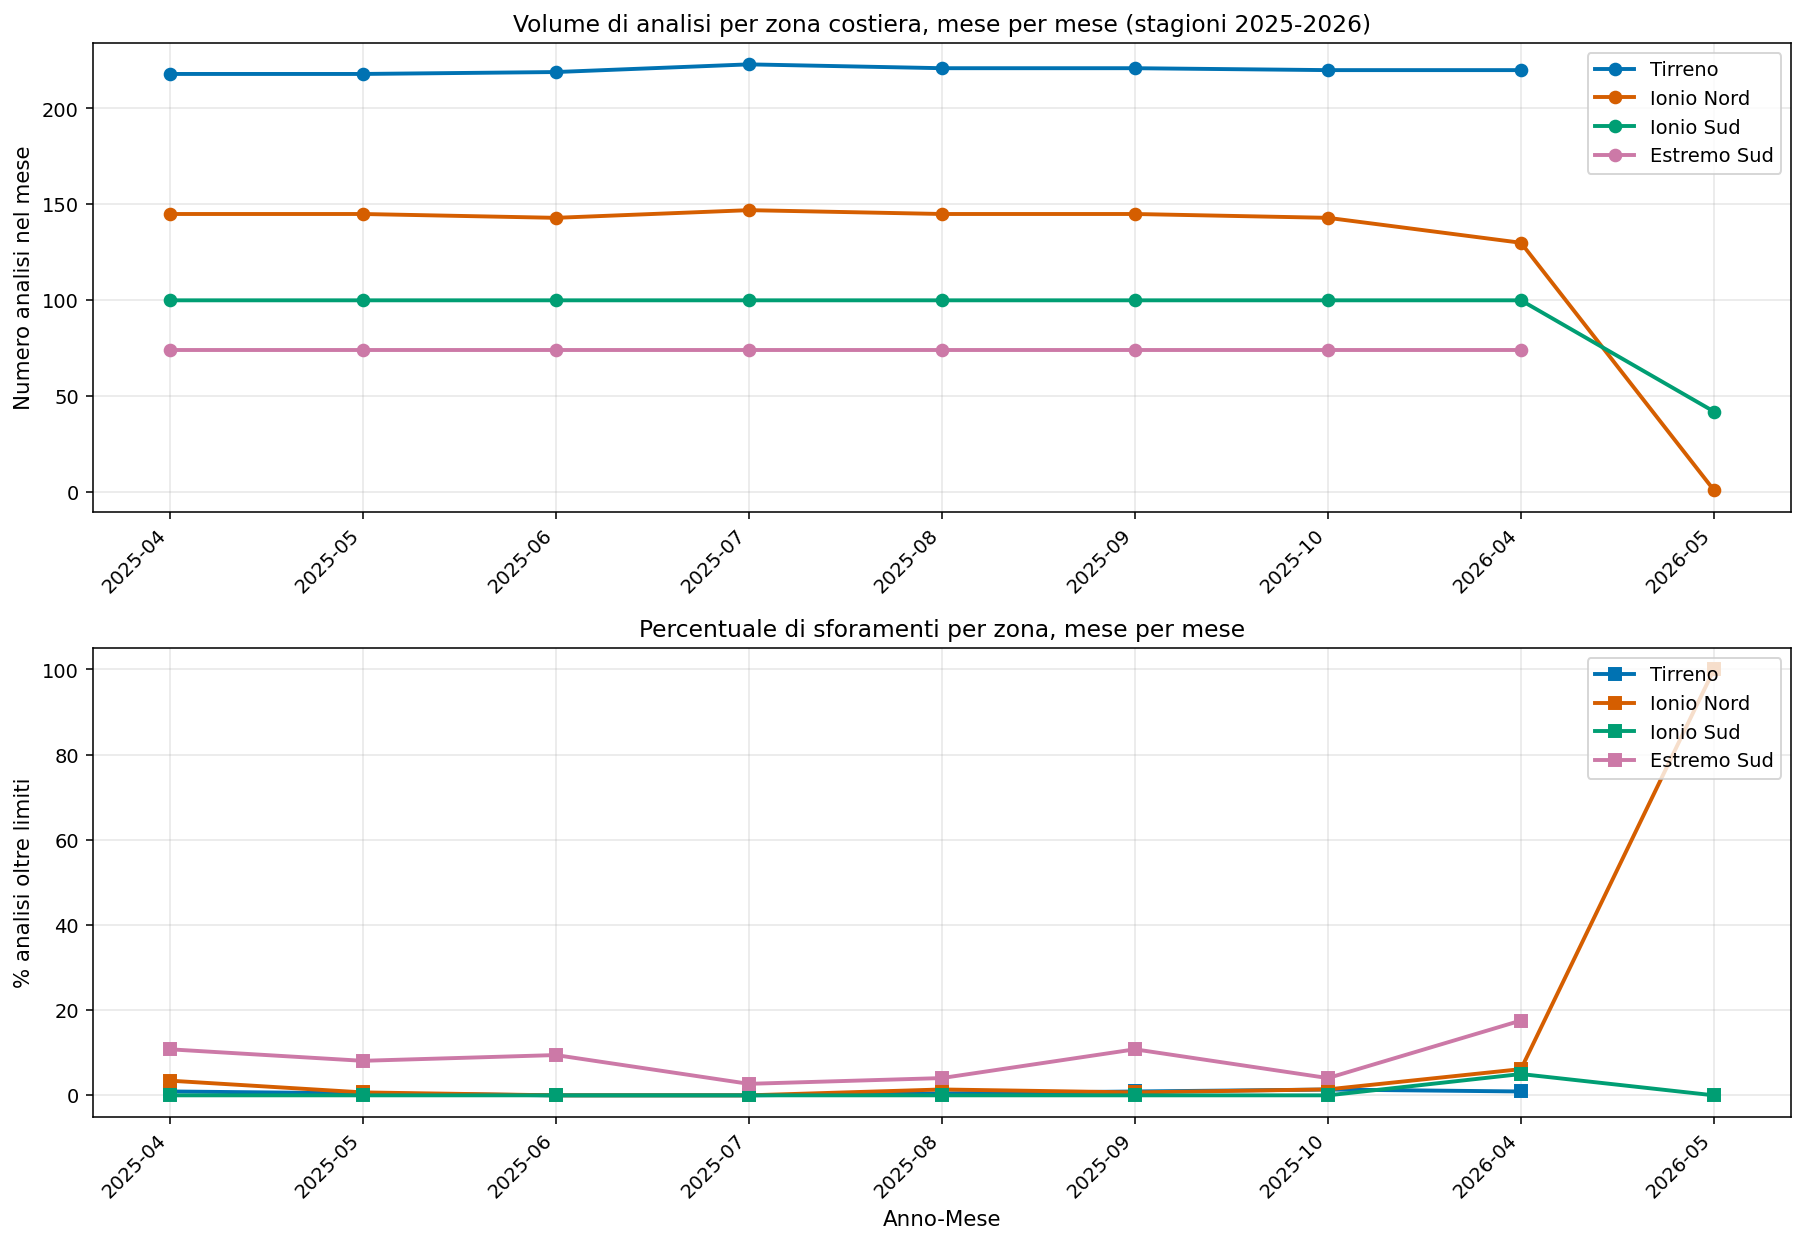
Figure 8.4 — Upper panel: number of analyses per month for each coastal zone, 2025 (April-October) and 2026 (April-May, ongoing) seasons. Lower panel: percentage of exceedances per month. The Tyrrhenian shows the highest monthly volume and the greatest regularity.
In the lower panel a peak of 100% is visible for the North Ionian in May 2026: it is a statistical artefact (very few analyses in that month, 1-2 exceedances produce high percentages) and not a real event of particular severity — the absolute number of exceedances is modest. It should always be read together with the volume of the month (upper panel) to avoid misleading interpretations.
The Calabrian Tyrrhenian coast, in the last two seasons, is the coast with the largest absolute volume of analyses (1,760) and with one of the lowest exceedance rates (0.62% — practically tied with the South Ionian). In absolute terms, it had only 11 'over-limit' results. It is a datum that deserves to be actively communicated by the Tyrrhenian operators: after 35 years of evolution, today this coast is one of the safest and best monitored of the Italian Mediterranean.
8.3 The overview map: bathing areas, river mouths, harbours
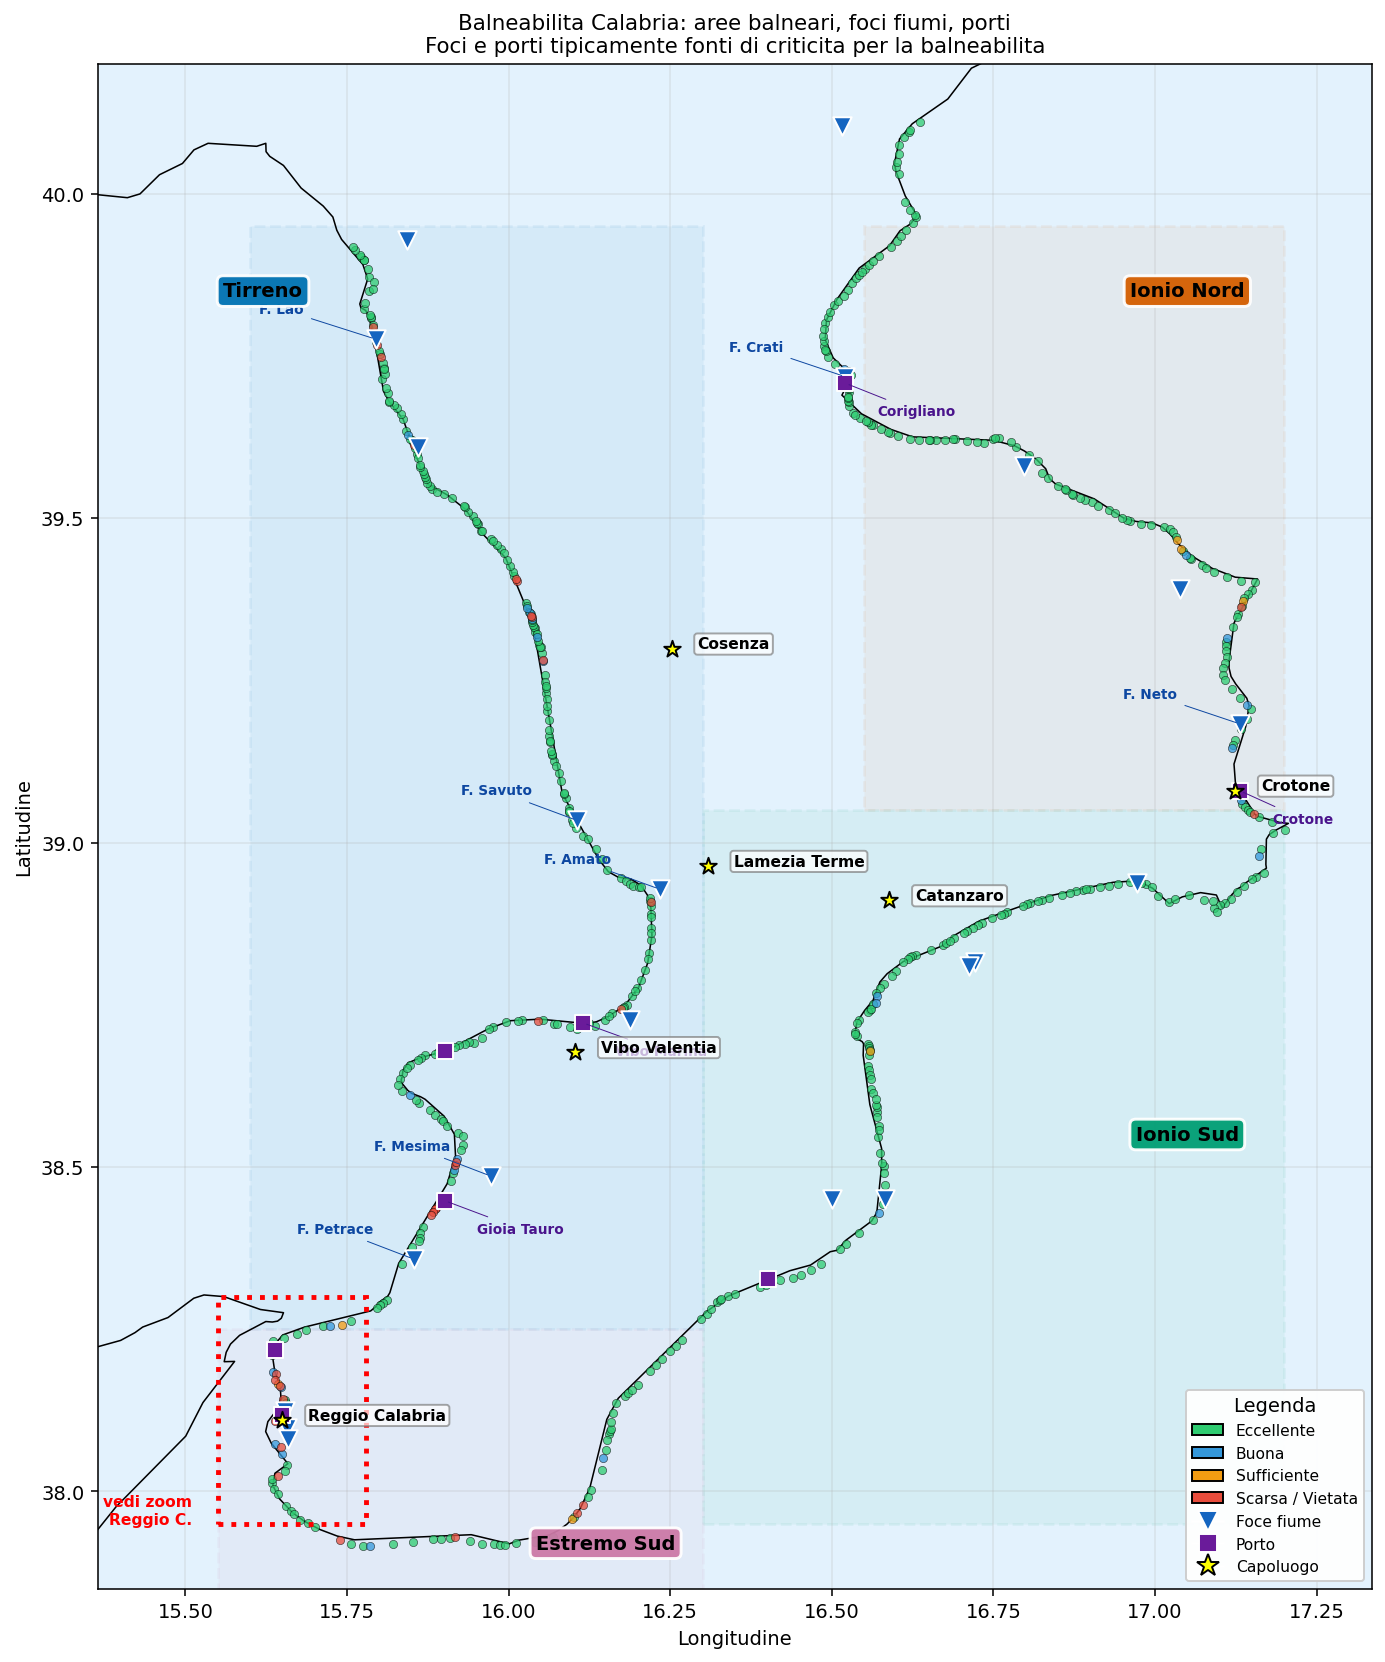
Figure 8.5 — Map of Calabria with all the bathing areas (540 with coordinates available), coloured by the quality class of their latest classification. Light-blue triangles = mouths of the main Calabrian rivers (Lao, Savuto, Amato, Mesima, Crati, Neto and others). Purple squares = commercial harbours (Gioia Tauro, Crotone, Vibo Marina, Corigliano, etc.). The red dashed box highlights the Reggio Calabria focus.
Two important elements that the map makes visible at a glance:
- The 'black spots' of bathing-water quality are clearly concentrated in the metropolitan area of Reggio Calabria (the Far South zone). A density of red markers that is not found anywhere else on the Calabrian coast.
- The few problem points outside Reggio are often near the mouths of important rivers — the Mesima near Rosarno/Gioia Tauro, the Delta Mesima, the Crati mouth at Sibari — or near commercial harbours. River mouths and harbours are by law never 'bathing waters' (they are excluded a priori), but the adjacent stretches of sea are indirectly affected.
8.4 Recent comparison by season (2025 vs 2026)
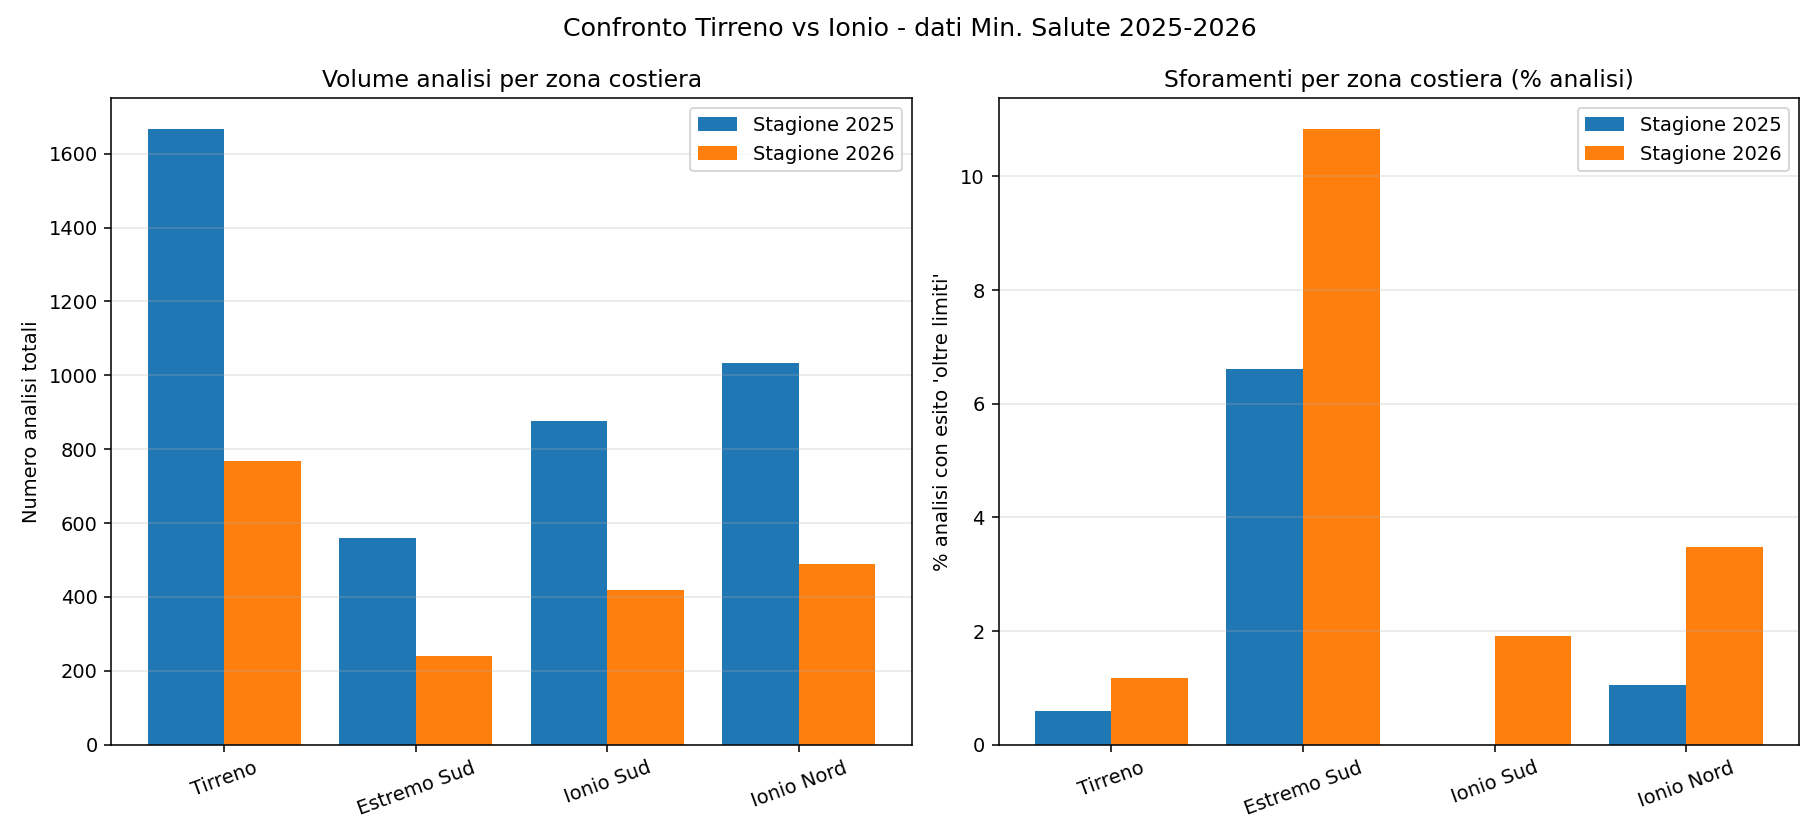
Figure 8.6 — Number of analyses (left) and percentage of exceedances (right) by coastal zone, separately for the 2025 and 2026 seasons. The Far South has exceedances an order of magnitude higher than the other zones, both in 2025 (complete season) and in 2026 (season ongoing at the time of writing).
The right-hand panel shows clearly that the Far South has a percentage of exceedances an order of magnitude higher than the other three zones, both in 2025 and in 2026. The other three zones are practically equivalent to each other, all below 2%. The 2026 season is still ongoing at the time of writing (it is May), so the 2026 figures should be read as partial, but the relative pattern between the zones is already evident.
8.5 Reggio Calabria: the anomalous metropolitan area
The metropolitan area of Reggio Calabria stands out clearly in the data: although it accounts for only 25 bathing areas out of a Calabrian total of 552, it contributes 9 of the 10 'worst' entries of the historical Hall of Shame. All the bathing areas of Reggio Calabria lie along the metropolitan coast of the Strait of Messina, between the harbour of Reggio to the south and the urban streams Annunziata, Calopinace and Sant'Agata.
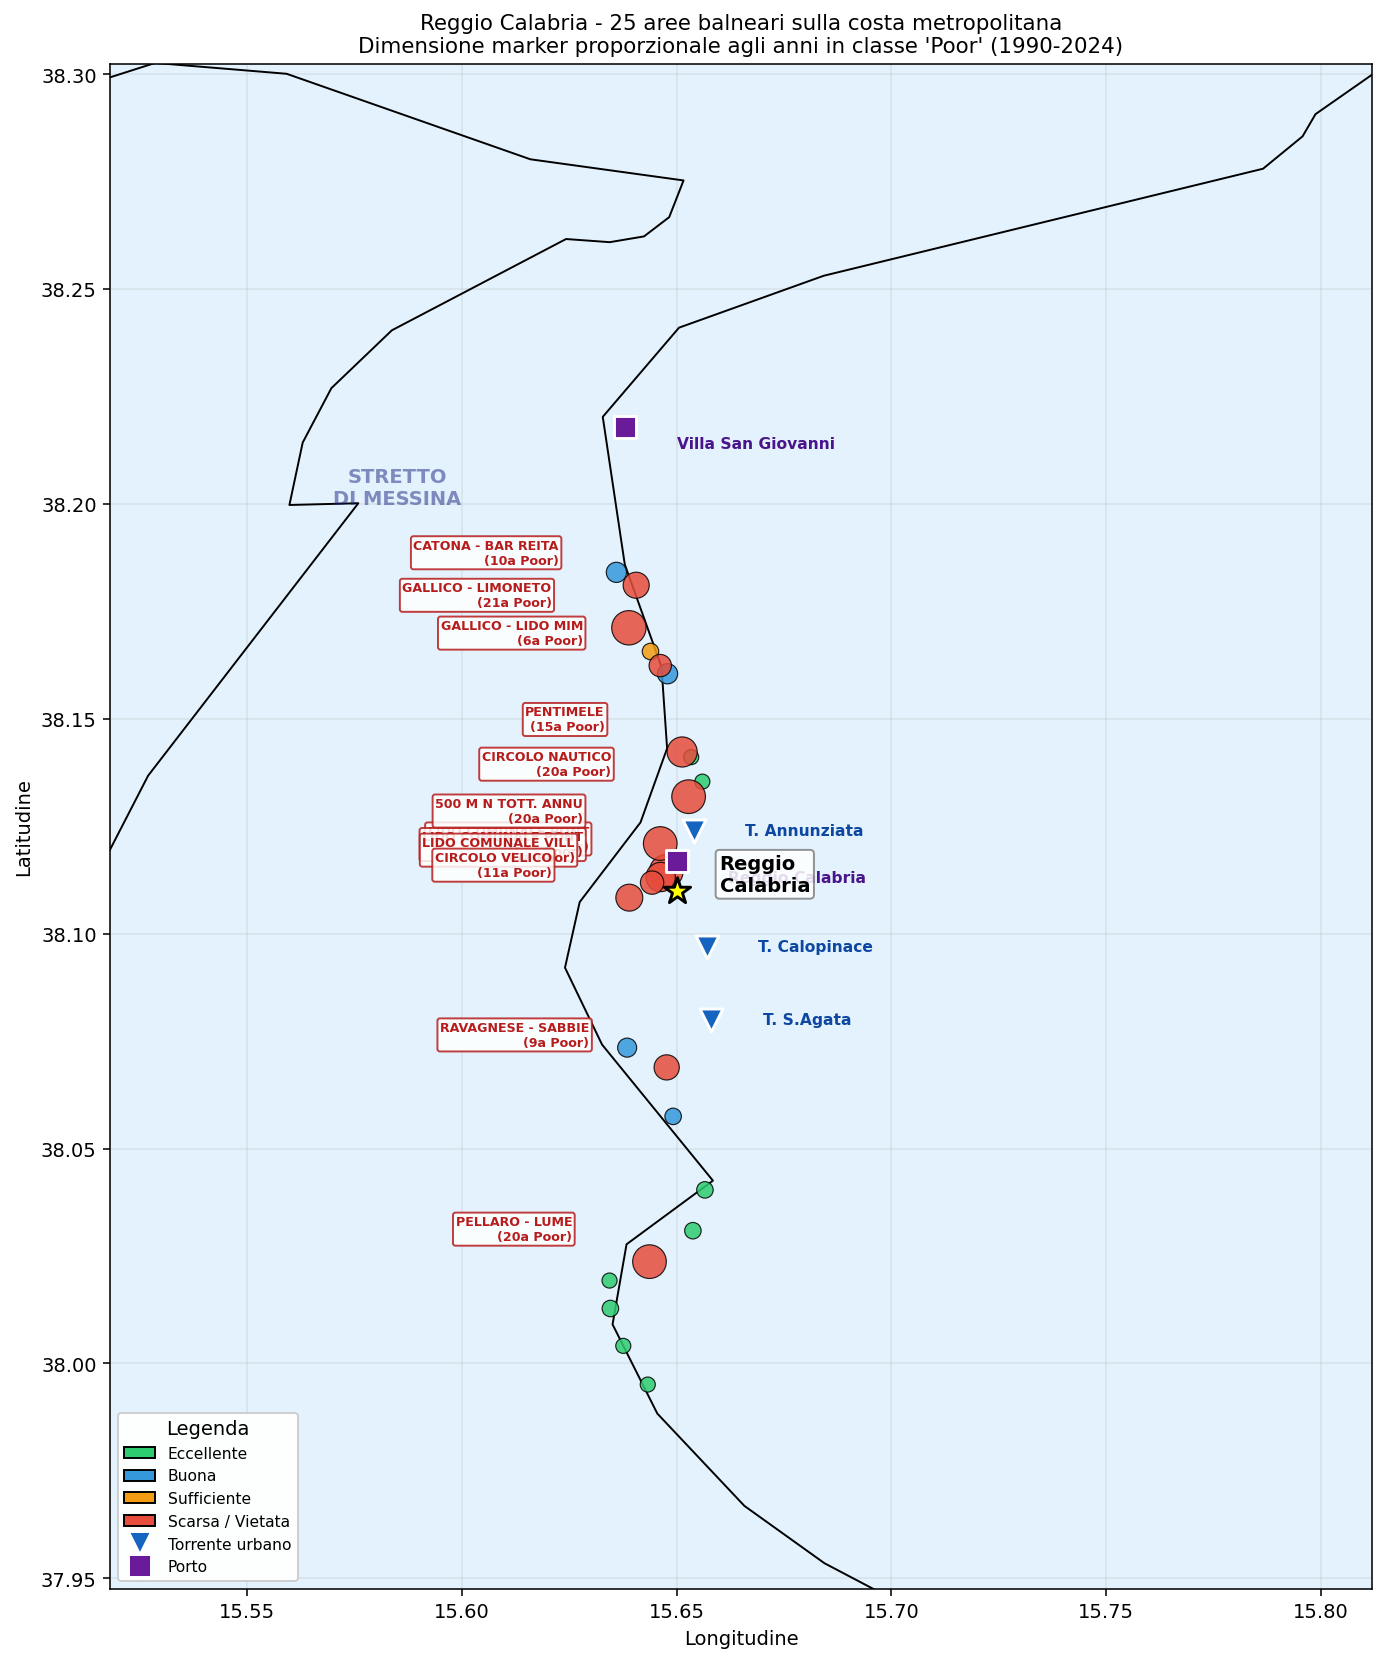
Figure 8.7 — Reggio Calabria, zoomed view of the metropolitan coast. 25 bathing areas on the coast of the Strait of Messina. Marker size proportional to the years in the 'Poor' class over the 1990-2024 period. Light-blue triangles = urban streams (Annunziata, Calopinace, Sant'Agata). Purple squares = harbours.
The concentration of problem areas (large red circles) is evident in the central part, corresponding to the urban area proper, between the harbour of Reggio Calabria to the south and the Annunziata stream to the north. These are long-standing urban concentrations: Pellaro to the south (beyond the airport area), Catona-Bar Reitano to the north, and the whole central belt between the Calopinace and the Annunziata.
Three urban streams cross the built-up area of Reggio Calabria: the Annunziata (northern part), the Calopinace (central area, with its mouth near the Granillo stadium) and the Sant'Agata (southern part, near the Lido Comunale). All three are dry or nearly dry for much of the year, but during intense rainfall they discharge significant amounts of torrential water into the sea, which can carry debris, urban sediment and, in some cases, sewage spills when the collectors overflow.
8.6 Temporal pattern: Reggio always 5-10 times above the regional average
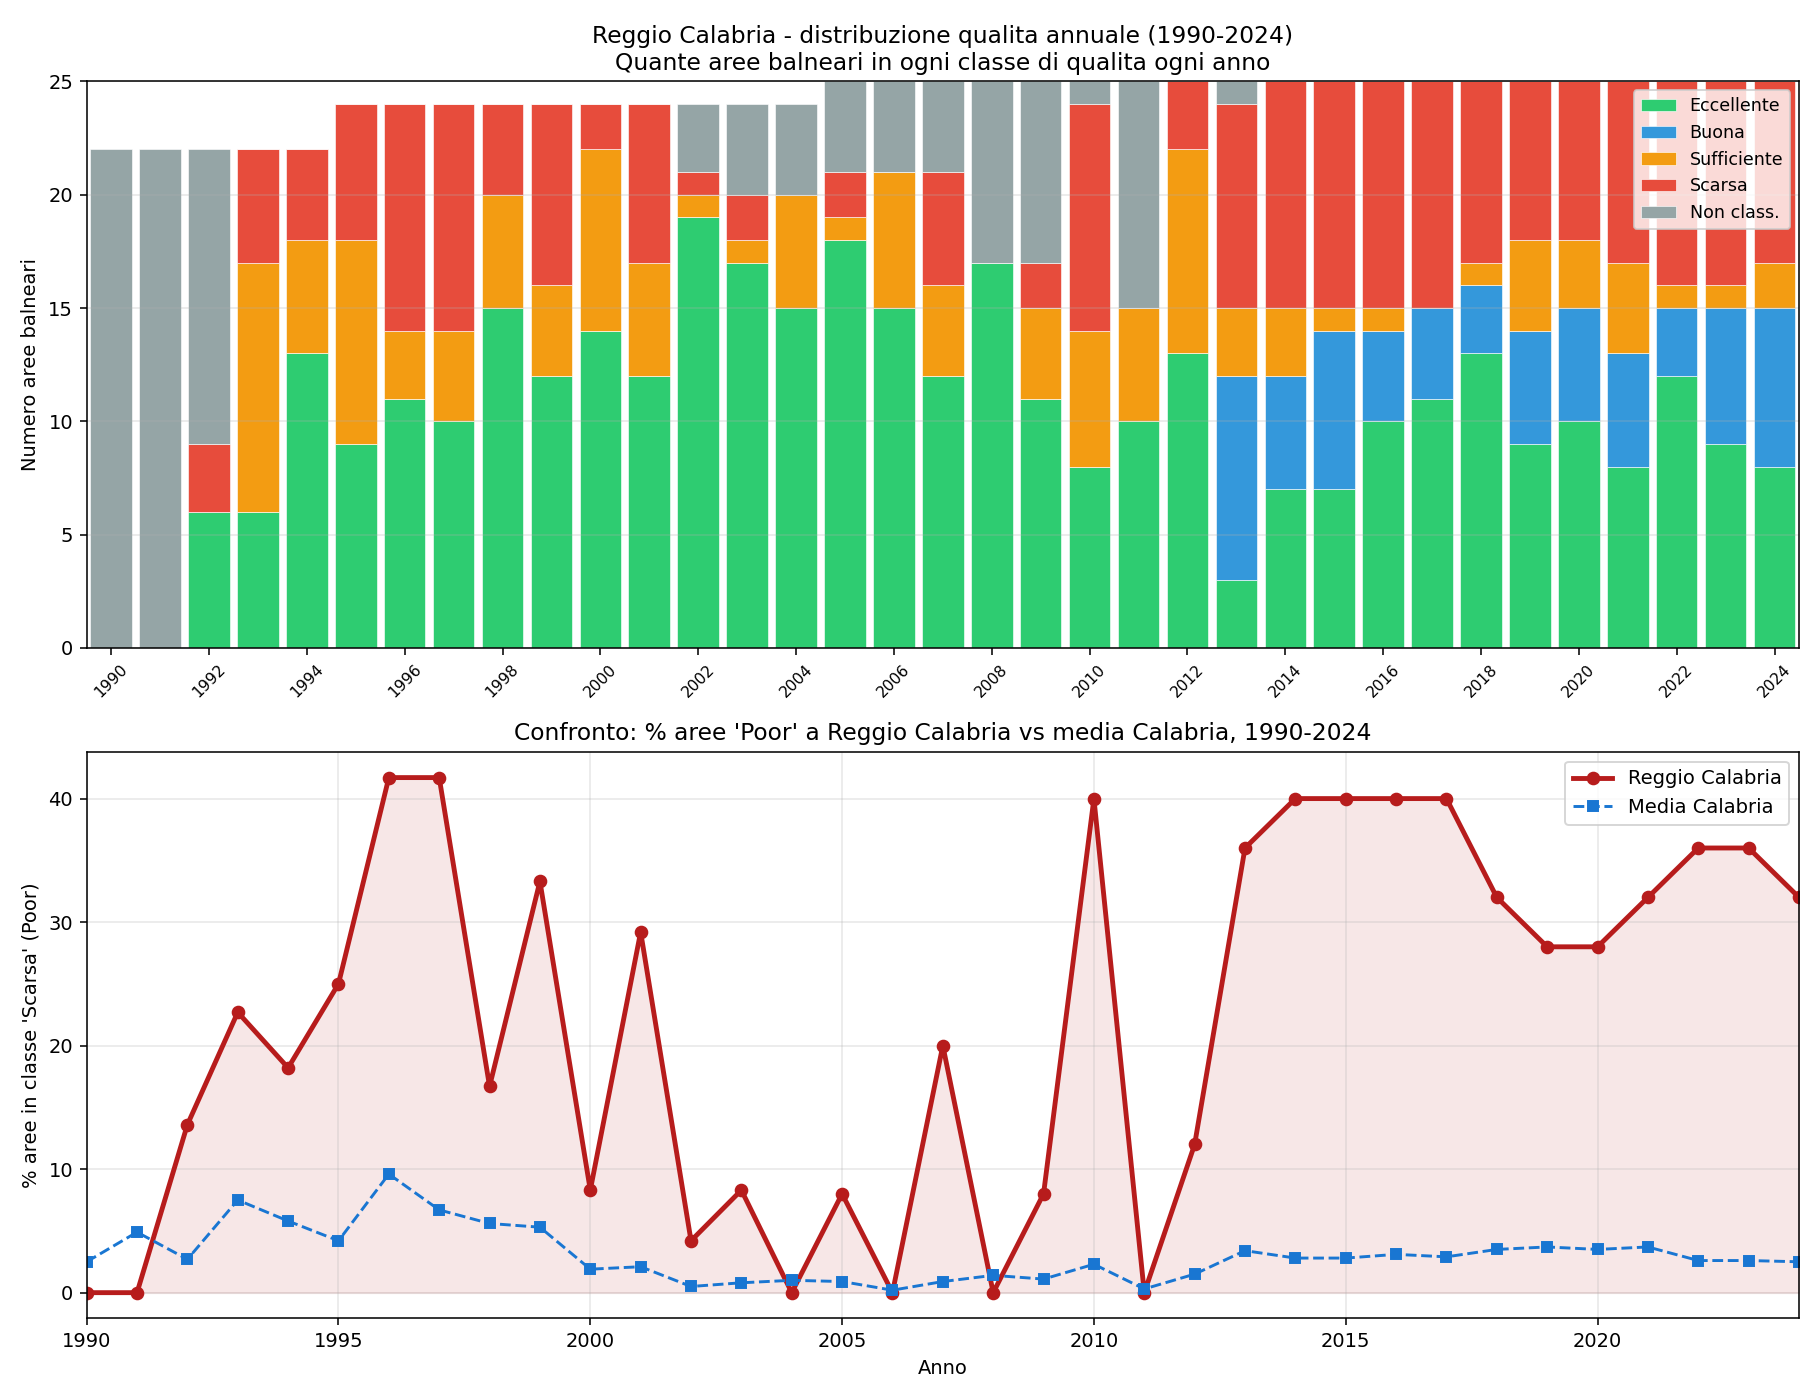
Figure 8.8 — Top: annual distribution of the 25 bathing areas of Reggio Calabria by quality class (1990-2024). Bottom: percentage of areas in the 'Poor' class in Reggio Calabria (red) compared with the Calabrian regional average (blue).
The lower panel illustrates the problem visually: the red line for Reggio Calabria sits practically always 5-10 times above the Calabrian regional average (blue line). In particular:
- In the 1990s it fluctuated between 20% and 40% of Poor areas — a quarter of the areas banned for pollution.
- Between 2003 and 2010 there was an improvement, with values dropping to 5-15%.
- From 2013 onwards it rose again steadily to 25-30%, where it still remains. That is 11 consecutive years with percentages among the highest of the whole historical series.
The jump in 2013 (a high number of 'not classified' areas in the upper heatmap) is probably linked to an administrative reorganisation: some areas were renamed or reallocated, and for a year or two they had no formal classification. But once that jump is absorbed, the pattern of structural problems returned exactly as before.
8.7 Top 10 critical areas of Reggio Calabria
| Area name | Poor years | % Poor | Exc. 25-26 | Nearby stream | Distance |
|---|---|---|---|---|---|
| GALLICO - LIMONETO | 21/35 | 60% | 2 | Annunziata stream | 5.5 km |
| PELLARO - LUME | 20/35 | 57% | 1 | Sant'Agata stream | 6.4 km |
| 500 M N TOTT. ANNUNZIATA | 20/35 | 67% | 8 | Annunziata stream | 0.9 km |
| LIDO COMUNALE PONTILE N | 20/35 | 57% | 5 | Annunziata stream | 1.3 km |
| CIRCOLO NAUTICO | 20/35 | 57% | 2 | Annunziata stream | 0.9 km |
| PENTIMELE | 15/35 | 43% | 0 | Annunziata stream | 2.1 km |
| LIDO COMUNALE PONTILE S | 14/35 | 40% | 3 | Annunziata stream | 1.5 km |
| CIRCOLO VELICO | 11/35 | 37% | 2 | Calopinace stream | 2.4 km |
| CATONA - BAR REITANO | 10/35 | 29% | 1 | Annunziata stream | 6.5 km |
| RAVAGNESE - SABBIE BIANCHE | 9/35 | 26% | 4 | Sant'Agata stream | 1.7 km |
A clear spatial correlation can be seen: 7 of the 10 worst areas are within 2.5 km of the Annunziata stream (the most critical mouth of Reggio), the others near the Calopinace or the Sant'Agata. The 'Lido Comunale Pontile N' and 'Lido Comunale Pontile S' areas are practically at the mouth of the Annunziata. The spatial pattern is unequivocal.
8.8 Hypotheses on the causes
The causes of the persistence of the problem in Reggio Calabria are most likely multiple and interconnected. Without a detailed environmental investigation we can only list the most probable factors, in order of plausibility:
- Urban streams not sufficiently treated upstream. The catchments of the Annunziata, Calopinace and Sant'Agata cross the built-up area of Reggio Calabria (~180,000 inhabitants). Any sewer overflows, unauthorised discharges and urban runoff after intense rainfall end up directly in the Strait within minutes.
- Insufficient treatment-plant capacity. The southern section of Reggio (Pellaro, Bocale) has historically had treatment problems documented by regional investigations and European infringement procedures. The Gallico treatment plant (serving the northern part) has been the subject of works in recent years.
- High population density in heavily urbanised stretches. Metropolitan beaches such as Pentimele, Catona and Pellaro have a very high summer human load, with related direct discharges (showers, illegal connections, etc.).
- Complex currents of the Strait of Messina. The currents between the Tyrrhenian and the Ionian in the Strait are notoriously irregular (the famous tidal streams that reverse the flow every 6 hours). This can accumulate pollutants in a non-linear way, creating 'pockets' of stagnant water in some stretches.
- The presence of two nearby harbours (Reggio Calabria and Villa San Giovanni, with ferries) that generate continuous maritime traffic, with bilge discharges, fuel residues and other sources of contamination that are not microbiological but still relevant for water quality.
All these causes add up — they are not alternatives. The only way to reduce the problem structurally would be coordinated investment in: (a) the modernisation of the treatment plants, (b) less permissive sewer-overflow systems, and (c) better management of urban stormwater. It is the only truly significant problem of the whole Calabrian coast, and it deserves a dedicated investment priority.
PART IV
Unified summary
9. A coordinated reading: what the overall picture tells us
Parts II and III have looked at the Calabrian sea under three dimensions that everyday practice often keeps separate but which in reality intertwine: the physical-environmental dimension (temperature, wind, stratification, mucilage preconditions), the microbiological dimension (presence of bacteria indicating faecal contamination) and the biogeochemical dimension (nutrients, phytoplankton biomass, turbidity, acidification). In this chapter we place them explicitly side by side to read the overall picture of the Calabrian coast, identify its strengths and weaknesses, and draw operational implications for those who work in coastal tourism and for those who manage the land.
9.1 The three dimensions of a 'quality sea'
The four analyses that converge in this document measure three distinct but connected dimensions of the quality of the Calabrian sea. The PHYSICAL-ENVIRONMENTAL dimension concerns the physical state of the marine ecosystem and its temporal tendency: temperature, wind, stratification, mucilage preconditions, mortality of gorgonians and posidonia. It is measured mainly with Copernicus satellite data (SST, wind) and a physical model (bathymetry, currents). The MICROBIOLOGICAL dimension concerns the health safety of bathers: the presence of bacteria indicating faecal contamination (E. coli, enterococci) in the waters used for bathing. It is measured with local-health-authority sampling (Ministry of Health + EEA). The BIOGEOCHEMICAL dimension concerns the chemistry and biology of the waters: nutrients (NO3, PO4), phytoplankton biomass (observational satellite chlorophyll + model NPP), water turbidity (KD490), pH and buffering capacity (acidification), salinity. It is measured with the MedBFM biogeochemical model and ocean-colour satellite observations, detailed in the BGC appendix.
They are INDEPENDENT dimensions in the way they are measured: different sources, different methods, different regulatory standards. But their CORRELATION by coastal zone is illuminating and deserves a unified reading. The following table brings together the two profiles for each of the four Calabrian zones:
| Zone | Mucilage preconditions | Microbiological quality | Interpretation |
|---|---|---|---|
| Tyrrhenian | HIGH (warm, weak wind, semi-enclosed gulfs) | EXCELLENT IN THE RECENT PERIOD (86.2% historical Excellent, 0.62% exceedances over the largest regional volume of analyses) | Mucilage is the environmental problem; in terms of microbiological bathing-water quality the Tyrrhenian is today among the best monitored coasts, with the most solid results, in Italy. |
| Far South (Reggio C.) | INTERMEDIATE (cool thanks to the Strait currents, intermediate wind) | CRITICAL (74.4% Excellent, 7.87% historical Poor) | Mucilage is NOT the main problem; the problem is a structural microbiological one of the urban area of Reggio Calabria. |
| South Ionian | LOW (high wind, deep seabeds) | OPTIMAL (94.9% Excellent, 0.59% exceedances) | The best coast of Calabria under both profiles. Full coherence. |
| North Ionian | MEDIUM-HIGH (as warm as the Tyrrhenian, but windier) | GOOD (90.2% Excellent, 1.75% exceedances) | An intermediate pattern: like the Tyrrhenian for physics, slightly better for bathing-water quality. A possible effect of the AIS mixing. |
The key message that emerges from the table is more nuanced than it appears at a first glance. In terms of absolute excellence on both dimensions, it is the Calabrian South Ionian that comes first: for those seeking a sea with the lowest possible likelihood both of mucilage and of microbiological exceedances, the Locride - Soverato - Catanzaro Marina stretch is objectively the first-quality choice in Calabria. But the Calabrian Tyrrhenian coast — although it is the coast most exposed to conditions favourable to mucilage for physical and morphological reasons — is from the MICROBIOLOGICAL point of view one of the best in Italy: with 1,760 analyses and only 11 exceedances in the last two seasons, it has figures that on their own justify a positive and proactive narrative (see Chapter 8.2). For the other three coasts the situation is more nuanced and requires differentiated communication and management.
9.2 The three regional long-term stories
Putting together the historical series of the three dimensions, three different stories of evolution over time emerge for the different parts of the Calabrian coast. They are stories that deserve to be told in a narrative way, because they explain a lot of the current situation.
The Tyrrhenian: the real silent success of the Calabrian coast
The Calabrian Tyrrhenian coast has experienced over the last 35 years a success story that deserves to be told with more emphasis than is usually done. In the 1990s this coast had over 10% of bathing areas in the 'Poor' class every year (with peaks of 12%). Today that percentage is steadily around 3% — a reduction of 70-75% sustained over time. Even more important: the data of the most recent seasons (2025-2026), which is based on the real individual samples and not on the aggregated annual classification, shows the Tyrrhenian as the Calabrian coast with the LARGEST absolute volume of analyses (1,760 — 47% of the regional total) and with one of the lowest exceedance rates (0.62%, tied with the South Ionian). In absolute terms, only 11 'over-limit' samples out of almost 2,000: a result that speaks for itself. This is the concrete and documentable fruit of the major European and national investments in treatment works (POR programmes, Water Protection Plans, EU infringement procedures) that affected the Calabrian Tyrrhenian coastal municipalities in the 2000s and 2010s.
There is, however, a second side of the story that should not be hidden: in parallel with the microbiological improvement, the Tyrrhenian has seen a marked worsening of the environmental precursors. The SST has risen by over 2 °C in 44 years, the windows of conditions favourable to mucilage have lengthened by 3-4 weeks, the MHW are now a chronic phenomenon. The tourist of 2026 therefore finds a paradoxical Calabrian Tyrrhenian coast: microbiologically very clean and well-monitored waters, but a sea that is warmer and stratified from the ecological point of view, with an increasing probability of finding mucilage on the shoreline in certain summer conditions. The different dimensions — physical (rising SST), microbiological (clearly improving) and biogeochemical (waters chemically cleaner than the other coasts) — must be read separately, but the main message for the tourism sector is markedly positive: the health and chemical quality of the Calabrian Tyrrhenian waters is today among the highest in Italy, and this is an asset to be communicated.
The stability of the Ionian
The Ionian (South and North) has stabilised over the last 15 years at excellent microbiological levels, and has kept the mucilage preconditions low for the structural reasons seen in Part II (deep bathymetry, higher wind, dynamic AIS currents). It is a story of stability that, in a general context of change, is in itself a value. The Calabrian Ionian coast is establishing itself as one of the most reliable bathing areas of the Italian Mediterranean, and this is an asset that deserves to be protected and valued.
The failed redemption of Reggio Calabria
The Far South (the metropolitan area of Reggio Calabria) is the only true Italian case of a failed microbiological evolution over the last 15 years. While the rest of the country has made enormous progress thanks to POR programmes, Water Protection Plans and EU infringement procedures that forced investment, Reggio Calabria has stood still. The causes are structural and deep-rooted: urban streams not sufficiently treated upstream, insufficient treatment-plant capacity, a metropolitan population density that generates concentrated human loads. It is paradoxical that precisely the 'coolest' coast of Calabria (because of the Strait currents) and with the weakest mucilage preconditions is the one with the worst microbiological quality. The physics of the sea helps here, the urban infrastructure penalises.
9.3 Implications for coastal tourism
The data collected have practical implications for the tourism operators of Calabria. They are implications that differ by zone, and it is important that each operator reads them specifically for their own territory instead of applying generic recipes.
For the beach clubs of the Tyrrhenian the message is twofold and should be communicated firmly. On the microbiological side the situation is objectively excellent: 1,760 analyses carried out in the last two seasons, of which only 11 out of norm (0.62%, practically tied with the South Ionian, but over a sample volume more than double); a 70-75% reduction in the problem areas relative to the 1990s; a stable improving trend in the last decade. This is a datum to be communicated proactively, with the official EEA and Ministry of Health figures to hand. A Tyrrhenian operator (beach club, hotel, coastal restaurant) can legitimately tell their customers: 'our sea is among the most monitored and among the cleanest in Italy, and the public data confirm it season after season'. It is a truthful message, supported by figures verifiable by anyone on the portal portaleacque.salute.gov.it. On the mucilage-precondition side, instead, the situation is worsening for general climatic reasons: the phenomenon exists and is increasing, but it is well characterised and predictable on the basis of the indicators of Ch. 6. Having ready, already at the start of the season, an informational page that explains what mucilage is and that it is NOT pollution can prevent the bad publicity from viral summer photos. Narrative anticipation, in this case, is worth more than a thousand after-the-fact defences.
For the beach clubs of the South Ionian (Locride, Soverato, Catanzaro Marina) the objective excellence of the data can be used as an element of commercial positioning. 'The only Calabrian coast with 35 years of EEA classification predominantly Excellent and weak preconditions for mucilage' is a truthful message, supported by public data, and easily verifiable by anyone. It is a message that can be used to differentiate both from the Calabrian Tyrrhenian coast and from other better-known but more crowded Mediterranean destinations.
For the Far South (Reggio Calabria) transparency on the data is paradoxically the only way to avoid word of mouth worse than reality. The metropolitan area has documented problems but with specific georeferencing: some areas (the EEA data themselves say so) are perfectly suitable for bathing and in the Excellent class. A granular communication based on the official data is worth more than a generic defence of 'the sea of Reggio'. Specific operators can use the map of the EEA areas to communicate honestly the situation of their own particular beach, avoiding being associated with the truly problematic areas of the centre.
For the whole of Calabria, finally, a general observation holds: the real-time monitoring (Ministry of Health portal) is accessible to everyone, free of charge, transparently. A sign with a QR code on the beach club that leads directly to the page of its own bathing area increases the tourist's trust much more than a self-certification of quality. It is an investment of a few euros that can make the difference in the perception of the service offered.
9.4 Implications for land management
From the point of view of public land management, the intervention priorities emerge clearly from the data.
- Priority number one is the metropolitan area of Reggio Calabria. All the rest of the Calabrian coast has manageable problems or is already in a condition of excellence. Concentrating infrastructure resources on Reggio (modernisation of treatment plants, less permissive sewer-overflow systems, management of urban stormwater) would give the highest cost/benefit ratio in terms of improving the regional bathing-water quality.
- For mucilage on the Tyrrhenian, prevention activity cannot be limited to cleaning the beach clubs during the event: an alert system is needed based on the precursor indicators (described in Ch. 6 and formalised in Ch. 10) that allows operators to prepare 1-2 weeks before the event.
- The South Ionian must be PROTECTED. An area in such good condition is a regional resource to be preserved: the pressure on Locri - Soverato - Catanzaro Marina will increase over the years if the Tyrrhenian (Calabrian and Sicilian) continues to worsen, because tourists will tend to move. Planning of the tourist load and protection of the infrastructure are issues to be addressed NOW, not when it is too late.
- For the whole region, the datum of marine warming (+2 °C in 44 years) is not something that can be fought locally: it is a global climate phenomenon. But its effects can be attenuated with adaptation policies: early monitoring, differentiated management of the seasons, diversification of the tourism offer (mountain excursions, food and wine) to reduce the exclusive dependence on summer bathing.
10. Monitoring system, limitations and future developments
10.1 Automatic monitoring system (a two-dataset architecture)
One of the concrete operational proposals that emerges from this work is the creation of a real-time monitoring system of the precursor indicators discussed in the previous chapters. The system is not based on the same dataset used for the historical analysis — that would be impossible, given the 4-5 month lag of the reprocessed product. The correct architecture combines the two Copernicus datasets (REP and NRT) as follows.
Phase 1 — Building the thresholds (one-off, already carried out):
- From the REP historical series 1982-2025, the daily climatology (the expected mean SST for each day of the year) is computed over the reference 30-year period 1991-2020.
- The 90th-percentile threshold for each day of the year is also computed: this is the threshold beyond which one is in an MHW state.
- Analogous indicators for the mucilage preconditions are computed (expected May SST, critical thermal windows).
- These thresholds are saved locally as a reference table.
Phase 2 — Daily monitoring (operational):
- Every morning at 04:00 an automatic query to the NRT dataset (SST_MED_SST_L4_NRT_OBSERVATIONS_010_004) downloads the SST of the day just ended for the box of interest (Amantea-Lamezia or other boxes). Data volume: ~50 KB per box.
- The SST is compared with the expected climatology and with the 90th-percentile threshold for that day of the year. The anomaly, any ongoing MHW state, and a progressive mucilage-precondition indicator for the season are computed.
- The values are published as Home Assistant entities (sensor.sst_amantea_lamezia, sensor.anomalia_sst, sensor.indice_mucillagini) and archived historically.
- If predefined thresholds are exceeded, an automatic Telegram notification is sent with an indication of the alert level.
Phase 3 — Updating the historical archive (every six months, optional):
- Roughly every 6 months Copernicus publishes a new block of REP that extends the historical series.
- A six-monthly job refreshes the long-term charts and recomputes the linear trends.
- An analogous annual update for the EEA Bathing Water Directive dataset (typically published in June).
Proposed alert thresholds for mucilage on the Tyrrhenian:
| Trigger | Condition | Notification |
|---|---|---|
| Opening of the mucilage window | First daily SST ≥ 22 °C of the year | Notice: 'the stratification window starts today — watch for mucilage' |
| Entry into the critical window | First daily SST ≥ 24 °C | Notice: 'thermal window favourable to mucilage — active vigilance' |
| MHW ongoing | 5th consecutive day above the 90th percentile | Notice: 'a marine heatwave is under way' |
| Severe MHW (cat. III) | Anomaly > 3× the threshold-climate deviation | Alert: stress for gorgonians and posidonia, high HAB risk |
| Prolonged mucilage window | 10th consecutive day in the 24-28 °C range | Notice: 'precursor conditions consolidated, a possible event soon' |
| High monthly index | Monthly index > the 75th historical percentile | Weekly summary via Telegram |
The NRT datum has slightly less robust statistical characteristics than the REP: the values may be reassigned by a few tenths of a degree when the definitive REP is published. For alert purposes this is entirely irrelevant (an anomaly of +3 °C does not become +2.5 after the reprocessing); for historical-archive purposes it is handled with the six-monthly job of Phase 3.
10.2 Overall limitations of the analyses
It is only right, before concluding, to list the overall limitations of the analyses presented. They are limitations that do not invalidate the results but that must be kept in mind so as not to over-interpret them.
- The Copernicus SST data are reliable and of high quality, but they are satellite-based: they measure the surface skin of the sea (the first 1-2 mm). They do not see the vertical structure of the water column, fundamental for understanding stratification and the thermocline. For that, Argo profiles or the MED-MFC biogeochemical model would be needed.
- The Copernicus wind data have a coarse spatial resolution (~13 km) and are reliable on average but may miss local microclimates. The GWA (250 m resolution) improves on it but is a climatology, not a real-time datum.
- The EEA data provide the annual classification, not the individual samples. If in a given year an area had isolated exceedances but still ended up Excellent, that is not visible from the EEA data. For that, the specific ARPACAL archive would be needed, which is not always public.
- The Ministry of Health portal data cover only 2 seasons (current + previous). For intra-seasonal analyses over long historical series, ARPACAL would be needed.
- Nutrient data (chlorophyll, nitrogen, phosphorus) that would close the circle of the three triggering factors of mucilage were not analysed. They are available in the Copernicus BGC biogeochemical products and are the logical next step.
- Currents are treated only qualitatively, based on the literature. Quantifying them would require the surface velocities of the MED-MFC model.
- The hypotheses on the causes of the Reggio Calabria problems are plausible but not proven by this study. Additional environmental data (sewer discharges, rainfall events, bacterial species) would be needed to validate them rigorously.
- The assignment of bathing areas to the four coastal zones uses simple geometric criteria (latitude/longitude). Some areas at the boundary between zones might be classified differently with more refined ecosystem-based criteria.
With all these caveats, the picture that emerges from the data is in any case robust enough to support operational decisions: the warming is real, it is accelerating, it has concrete and already observable implications. The microbiological bathing-water quality is on average good but with localised problems that can be identified precisely. Environmental and tourism policies should take both these pieces of evidence into account.
10.3 Possible future developments
Several future developments are possible, some short-term (implementable in days or weeks), others medium-term (requiring months and external collaborations):
- Real-time mucilage alert system: extension of the script to the daily update of the SST (the Copernicus NRT product, 24-hour lag) and automatic computation of the precursor indicators. Notification via Telegram/Home Assistant when the index exceeds predefined thresholds. Development time: 1-2 hours.
- Spatial extension to other regions: include the Sicilian coast (Tyrrhenian and Ionian), Campania and Basilicata to validate the Tyrrhenian-Ionian pattern in other Mediterranean regions. Development time: a few days for each region.
- Integration with Copernicus BGC biogeochemical data — DONE. The MedBFM model (OGS Trieste) was downloaded and analysed for the 4 Calabrian zones + the Amantea-Lamezia focus, 1999-2024. The results and the 3-factor composite index are integrated in chapters 4.5 (zone comparison) and 6.5 (mucilage index). The main discovery: the North Ionian has a higher N:P ratio and NPP than the Tyrrhenian but less mucilage — a confirmation that the mechanical factor is dominant.
- Extension of the BGC analysis to another 4 indicators (observational satellite chlorophyll 1km, KD490 turbidity, pH/alkalinity, salinity) — DONE. Added to Ch. 4.5 and detailed in the technical appendix Relazione_BGC_Mucillagini.docx (chapters 8-11). All 6 indicators converge on the same conclusion: the Calabrian Tyrrhenian coast has no signatures of differential pollution, it is optically the clearest coast of the four zones.
- Automatic annual update: every year the EEA publishes the updated dataset. The script can be run annually to integrate the new season (2025 will be published in 2026).
- A deeper look at Reggio Calabria with specific data: in collaboration with ARPACAL and the Municipality of Reggio, the systematic collection of rainfall data, treatment-plant discharges and sewer-overflow events to statistically correlate causes and effects.
- A public web dashboard: making the SQLite database accessible via a simple dashboard (Streamlit, Flask) for citizens and operators. An interactive map, search by beach, CSV export.
- Tracking of georeferenced mucilage events: in collaboration with tourism operators and researchers, the systematic collection of geo-located mucilage reports to validate the precondition map and the precursor models.
- Verification with direct ARPA observations: a convergence of Copernicus data (SST), ARPA Calabria monitoring (Ostreopsis, bathing-water quality), and operator reports (direct observation of the shoreline) into a single unified weekly bulletin.
— End of the MASTER report —
The six detailed technical studies (SST and mucilage, Comparison of coasts, Bathing waters, Biogeochemistry, Social Analysis, Sea level and erosion) remain available as standalone documents in the Studies menu. The SQLite database (acque_calabria.db) and all the Python scripts are in the project copernicus_sst_calabria/.